Lecture EWEA 2000 - Slide 27
Aus Transnational-Renewables
| Lecture Magdeburg [2001,en], Vortrag Lübeck [2006,de], Lecture Barcelona [2008,en], Vortrag EWEA 2000 [2000,en] |
| Vorstellung regenerativer Energien: Biomasse, Windenergie, Fallwindkraftwerke, Geothermie, Wasserkraft, Solarenergie |
| Overview | 
|
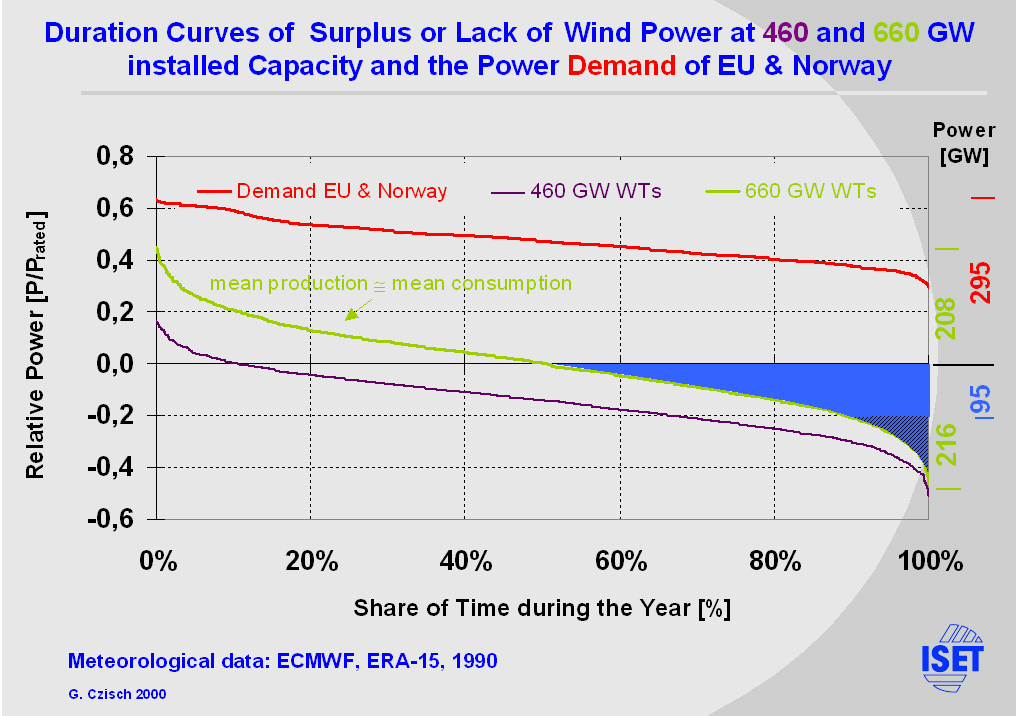
The slide shows the duration curve of the demand in EU & Norway and the duration curves of the difference between wind power production and demand at 440 or 660 GW of rated wind power installed within all regions.
At the 660 GW case more than the total lack of wind power production could be covered engaging the hydro power produced from existing storage hydro power plants within the area considered (see the blue field). But today's rated storage hydro power of 95 GW is not sufficient to compensate all occurrences of missing production (see the shaded area within the blue field) and thus there must be other power sources (pump storages, biomass fired plants ….).


