Lecture Barcelona 2008 - Overview
Aus Transnational-Renewables
Version vom 3. Oktober 2010, 12:41 Uhr von Reichardt (Diskussion | Beiträge)
| Lecture Magdeburg [2001,en], Vortrag Lübeck [2006,de], Lecture Barcelona [2008,en], Vortrag EWEA 2000 [2000,en] |
| Vorstellung regenerativer Energien: Biomasse, Windenergie, Fallwindkraftwerke, Geothermie, Wasserkraft, Solarenergie |
Renewable electricity within a Trans-European Supergrid
|
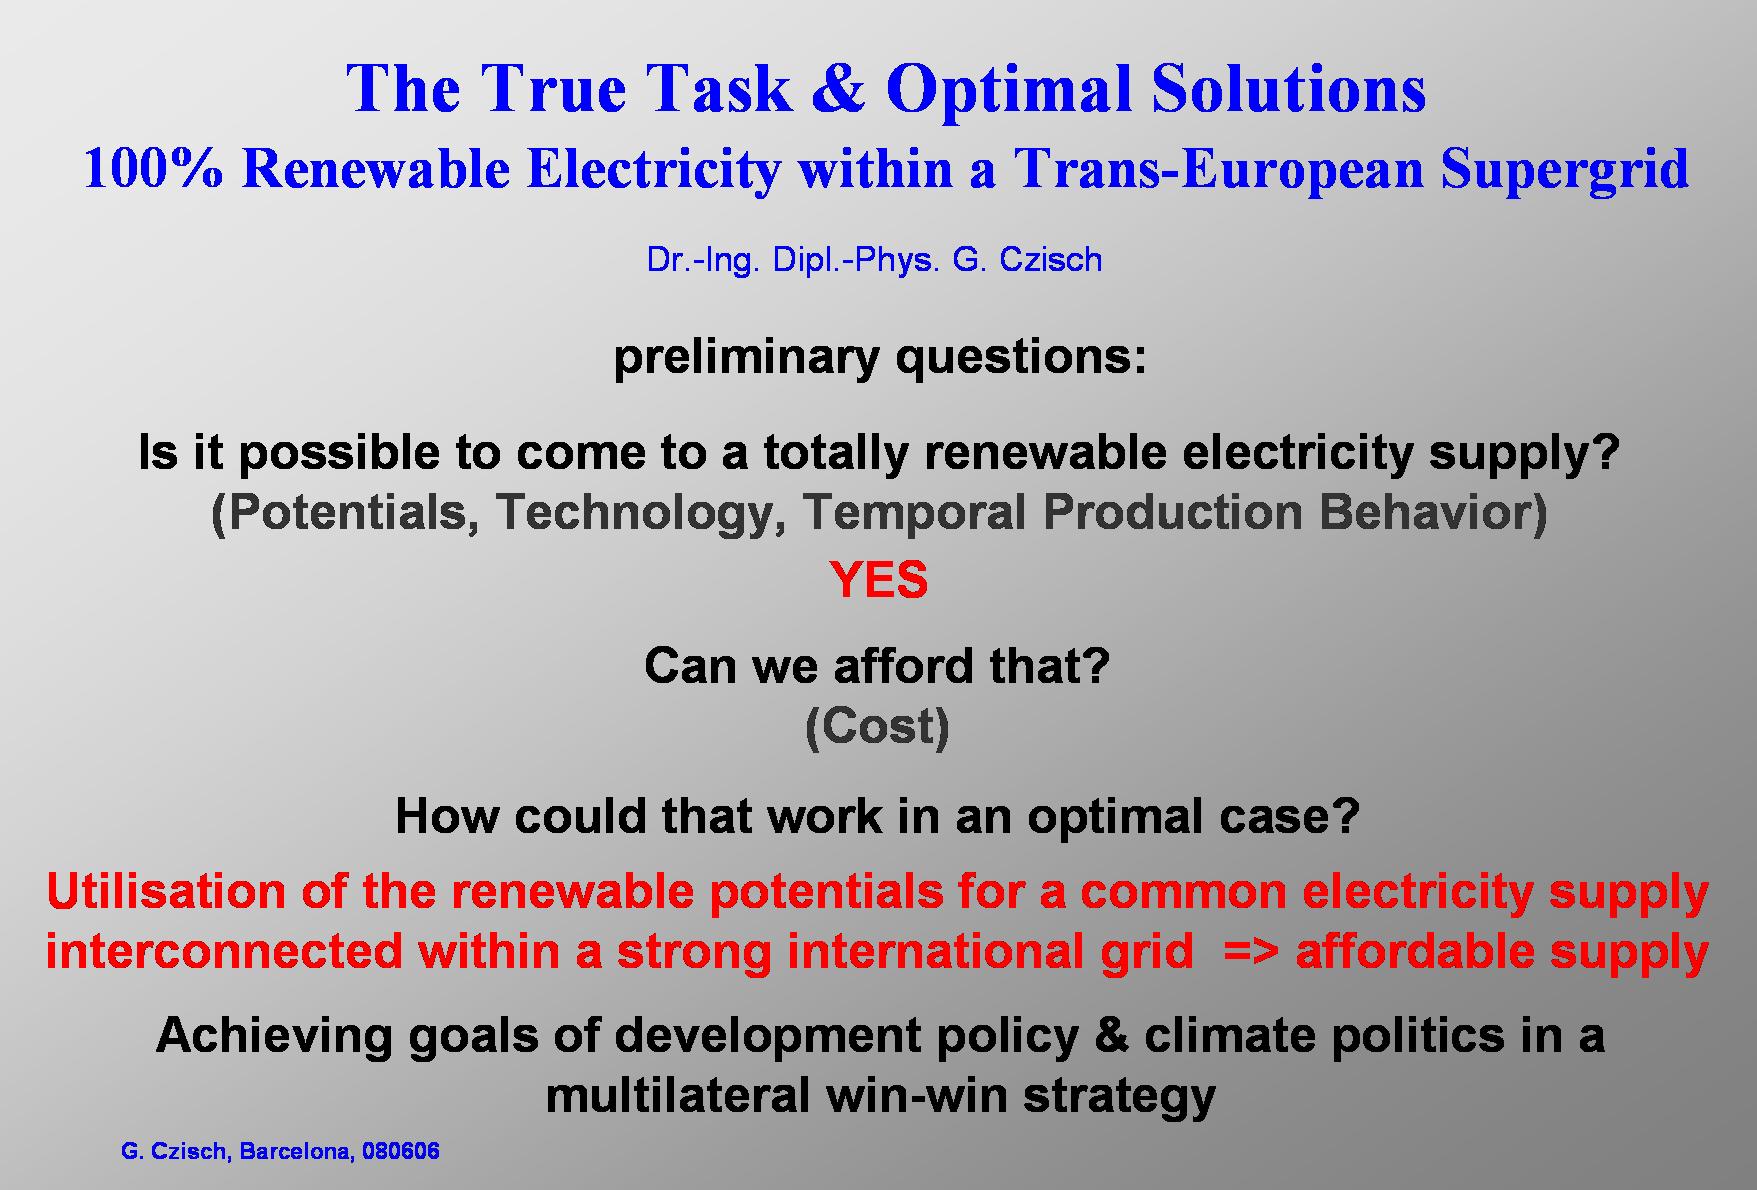
I my talk I will show that we can produce all our electricity from renewable sources.
This is a question concerning the worldwide potentials for renewable electricity production. The techniques for their use have to be considered. Techniques like electricity production via solar thermal power plants and hydropower and finally we will focus on wind energy or some more speculative options. For each of these options of electricity generation I am going to point out the characteristics with regard to their specific temporal behaviour and the costs to be expected. We will see that the temporal behaviour significantly changes with the size and the selection of the catchments area used for the electricity generation. We will also touch on the topics of backup and storage needs and the subject of grid capacities. The answer is clearly yes, it is possible to come to a totally renewable electricity supply. The next question – much more difficult to answer – is: Can we afford that? Yes, it will be shown that a change to a totally renewable electricity supply is neither a technical nor a economic problem but mainly a political task. How could that work in an optimal case? As an output of a mathematical optimisation we will see that a spacious international utilisation of renewable potentials for a common electricity supply within a strongly interconnected international grid is the optimal solution resulting in the cheapest renewable electricity.
Szenarien zur zukünftigen Stromversorgung - Kostenoptimierte Variationen zur Versorgung Europas und seiner Nachbarn mit Strom aus erneuerbaren Energien https://kobra.bibliothek.uni-kassel.de/handle/urn:nbn:de:hebis:34-200604119596 Low Cost but Totally Renewable Electricity Supply for a Huge Supply Area http://www.iset.uni-kassel.de/abt/w3-w/projekte/LowCostEuropElSup_revised_for_AKE_2006.pdf |
|
Now we come to hydropower.
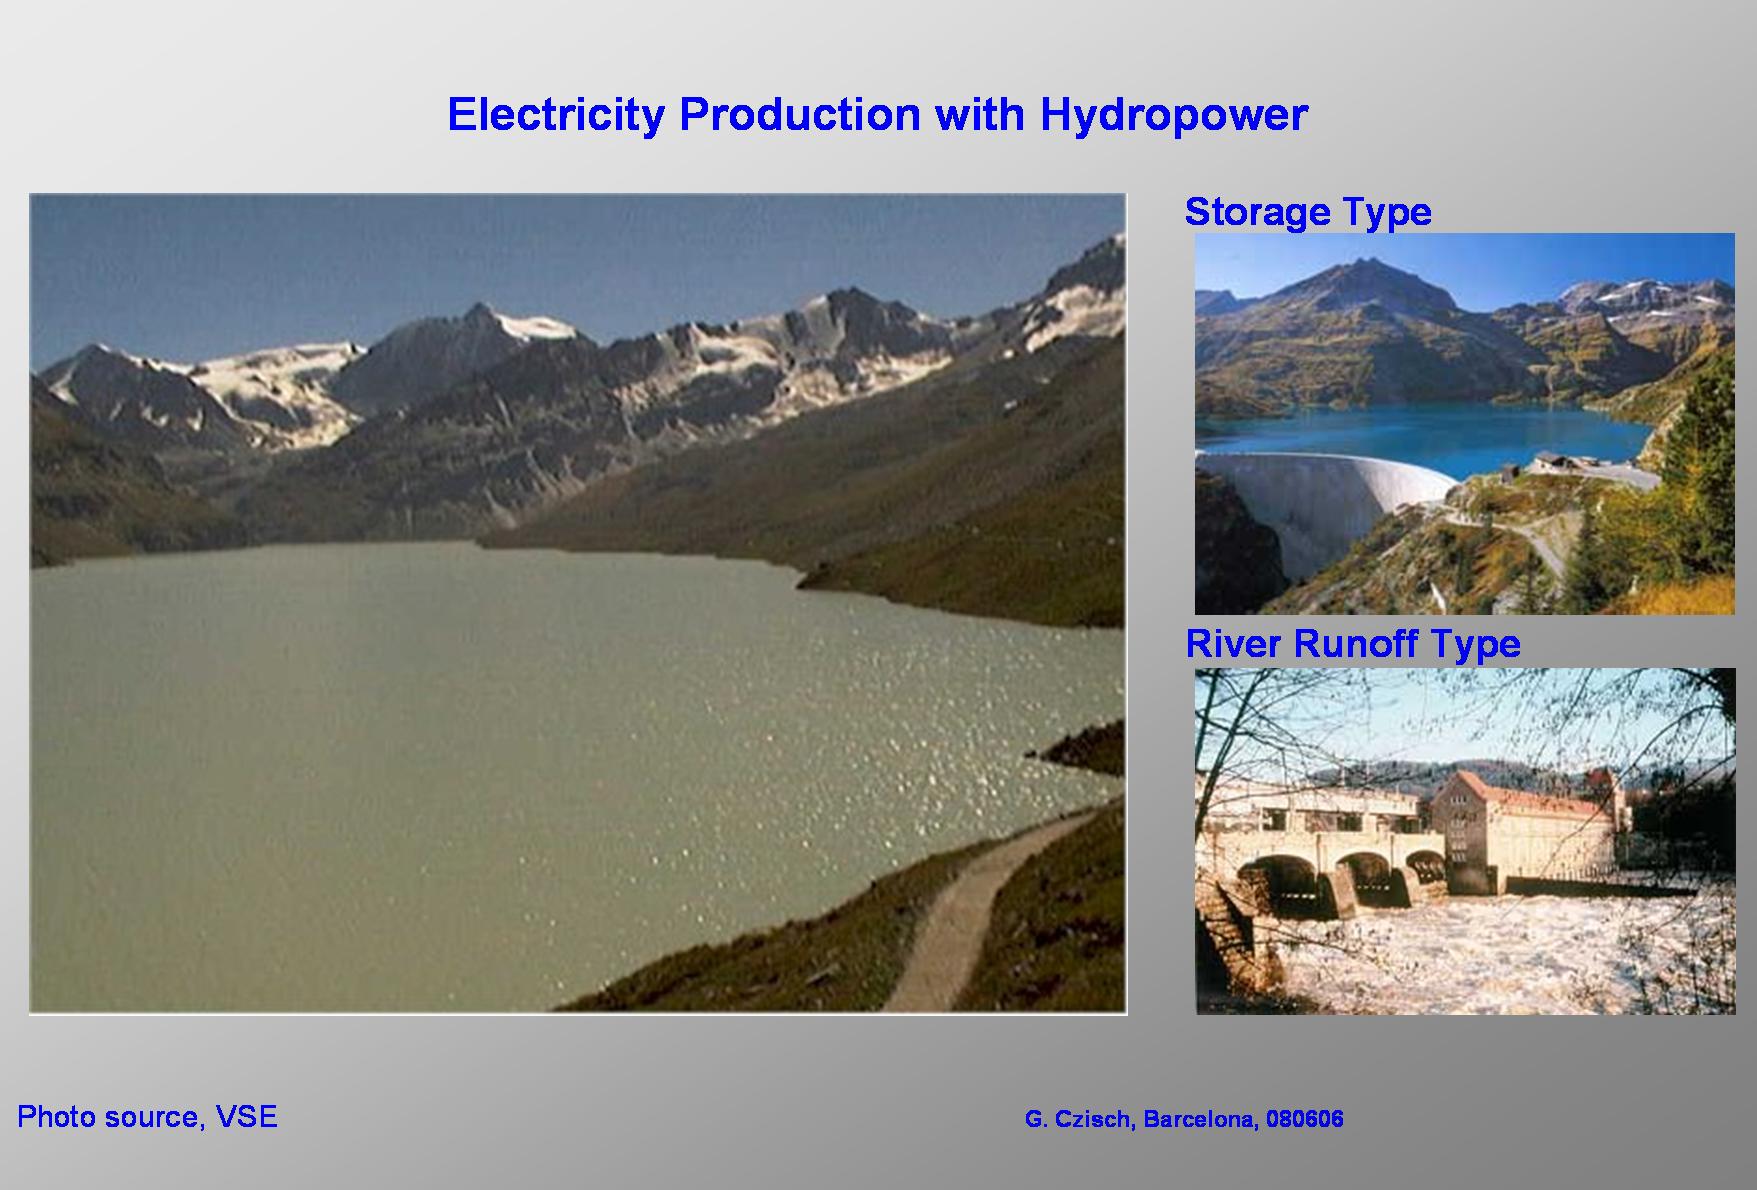
Here it is worth to distinguish between two types. The river runoff type uses the water at the time it runs down the river and normally has no or just very little storage capacity. The storage type sometimes can store the water which is running into its reservoir for many months (see following table). So this kind of power plant decouples runoff and electricity production and thus gives the degrees of freedom necessary to be used as back up to balance the variation of other production facilities and of the demand. |

|
This Table shows the rated power, the storage capacities and the annual energy production of Storage Hydroelectric Power Plants in Western European Countries. The storage capacities are close to 10% of the total electricity production within all the member countries of the EU-15 (this is more than the average electricity consumption of one month) and the annual production was roughly 15% of the annual consumption within the UCTE and the Nordel network in 1998. |

|
Here you see a view of a solar thermal power plant which leads us to the potentials of this kind of electricity production. The direct solar radiation is concentrated in parabolic troughs to heat up a fluid that is used to power a conventional thermal power plant. Dependent on the design of the power plant the heat is used with an efficiency between approx. 32 and 38 % to produce electricity. |

|
The heat can not only flow directly into the thermal power plant but can also be stored within a thermal storage. This storage is characterised by relative low storage losses (high storage efficiencies) and relatively low costs. If properly designed with the right size the storage can make electricity production cheaper since it allows for the installation of lower rated power of the conventional steam power plant which is – up to a certain storage capacity – specifically more expensive than the corresponding capacity of the thermal storage. With thermal storage solar thermal power plants can generate solar electricity day and night. |
|
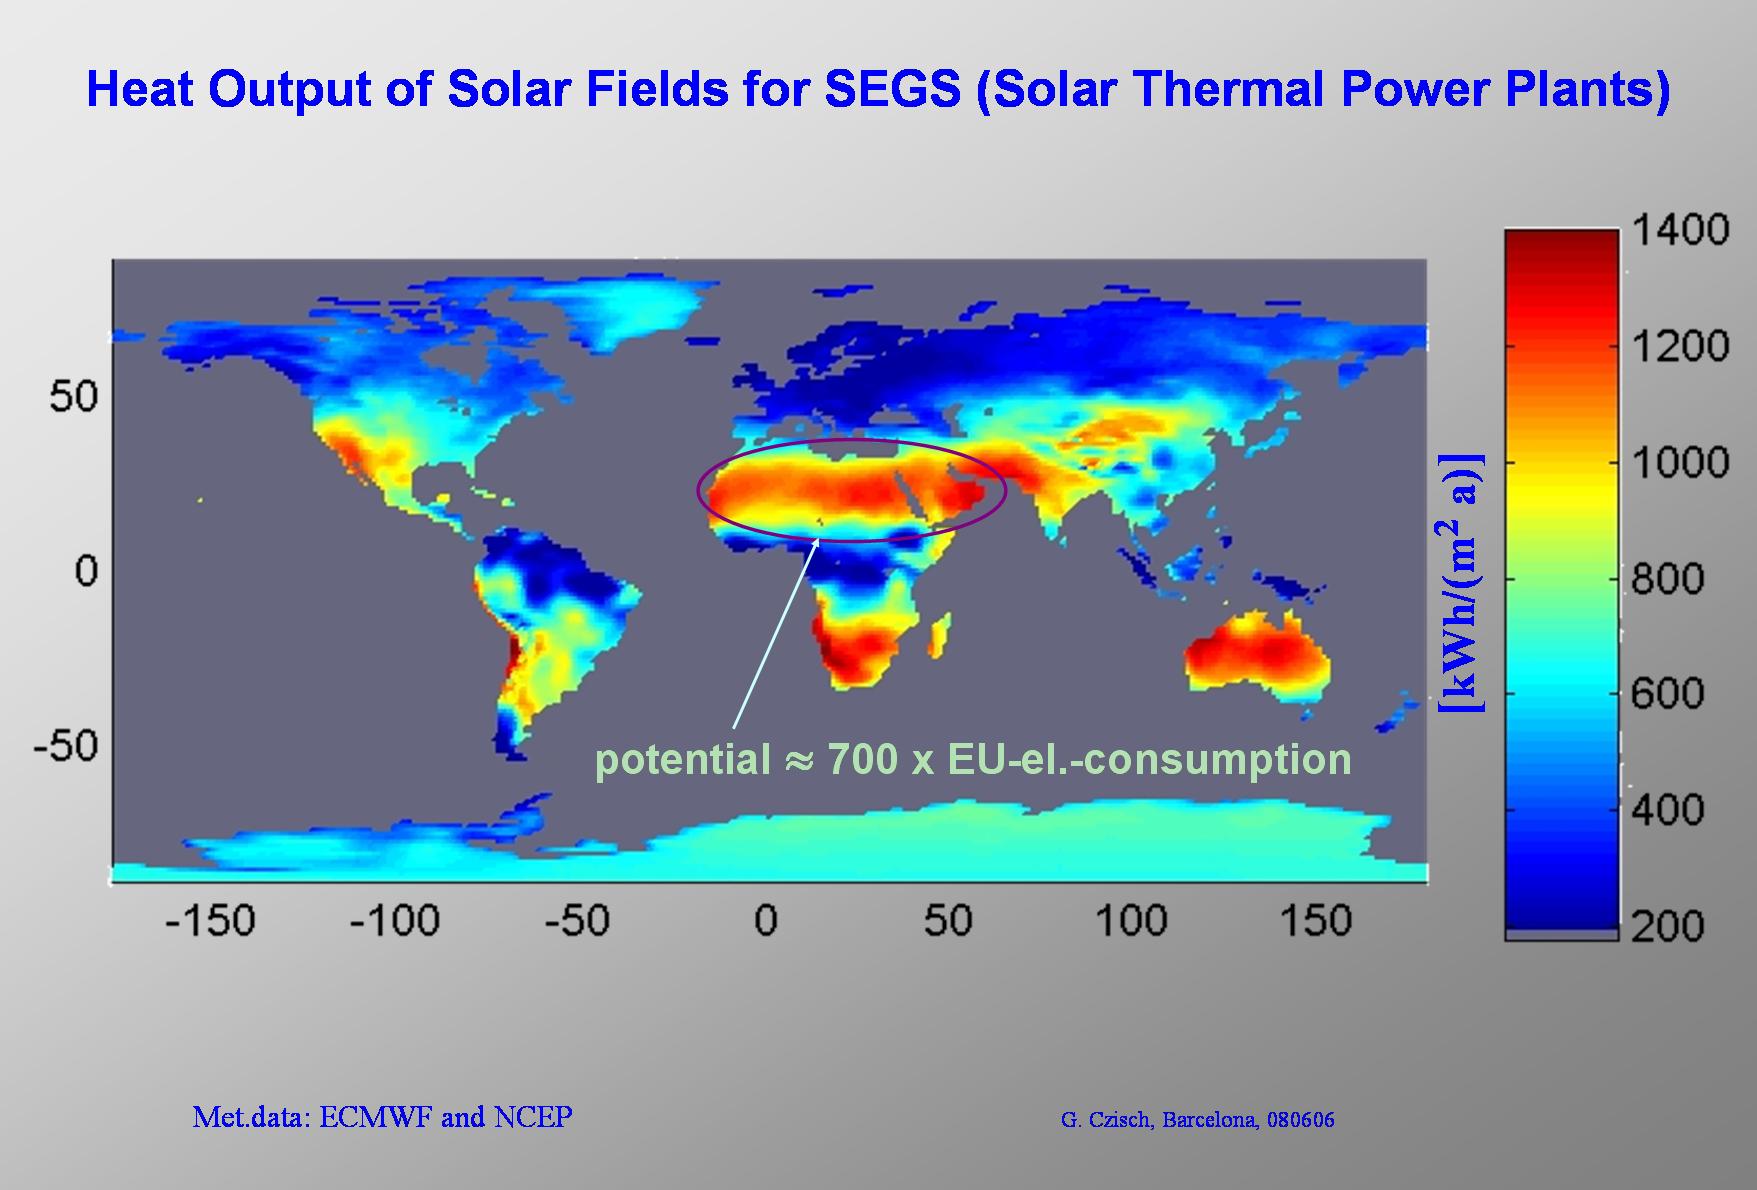
Here the potential heat production of the solar field of a solar thermal power plants (SEGS) is shown. Very good conditions are found in the Sahara and the Saudi Arabian peninsula where the potential electricity production is more than 700 times (roughly 500 and 200 times) the electricity consumption of the EU member states. |
|
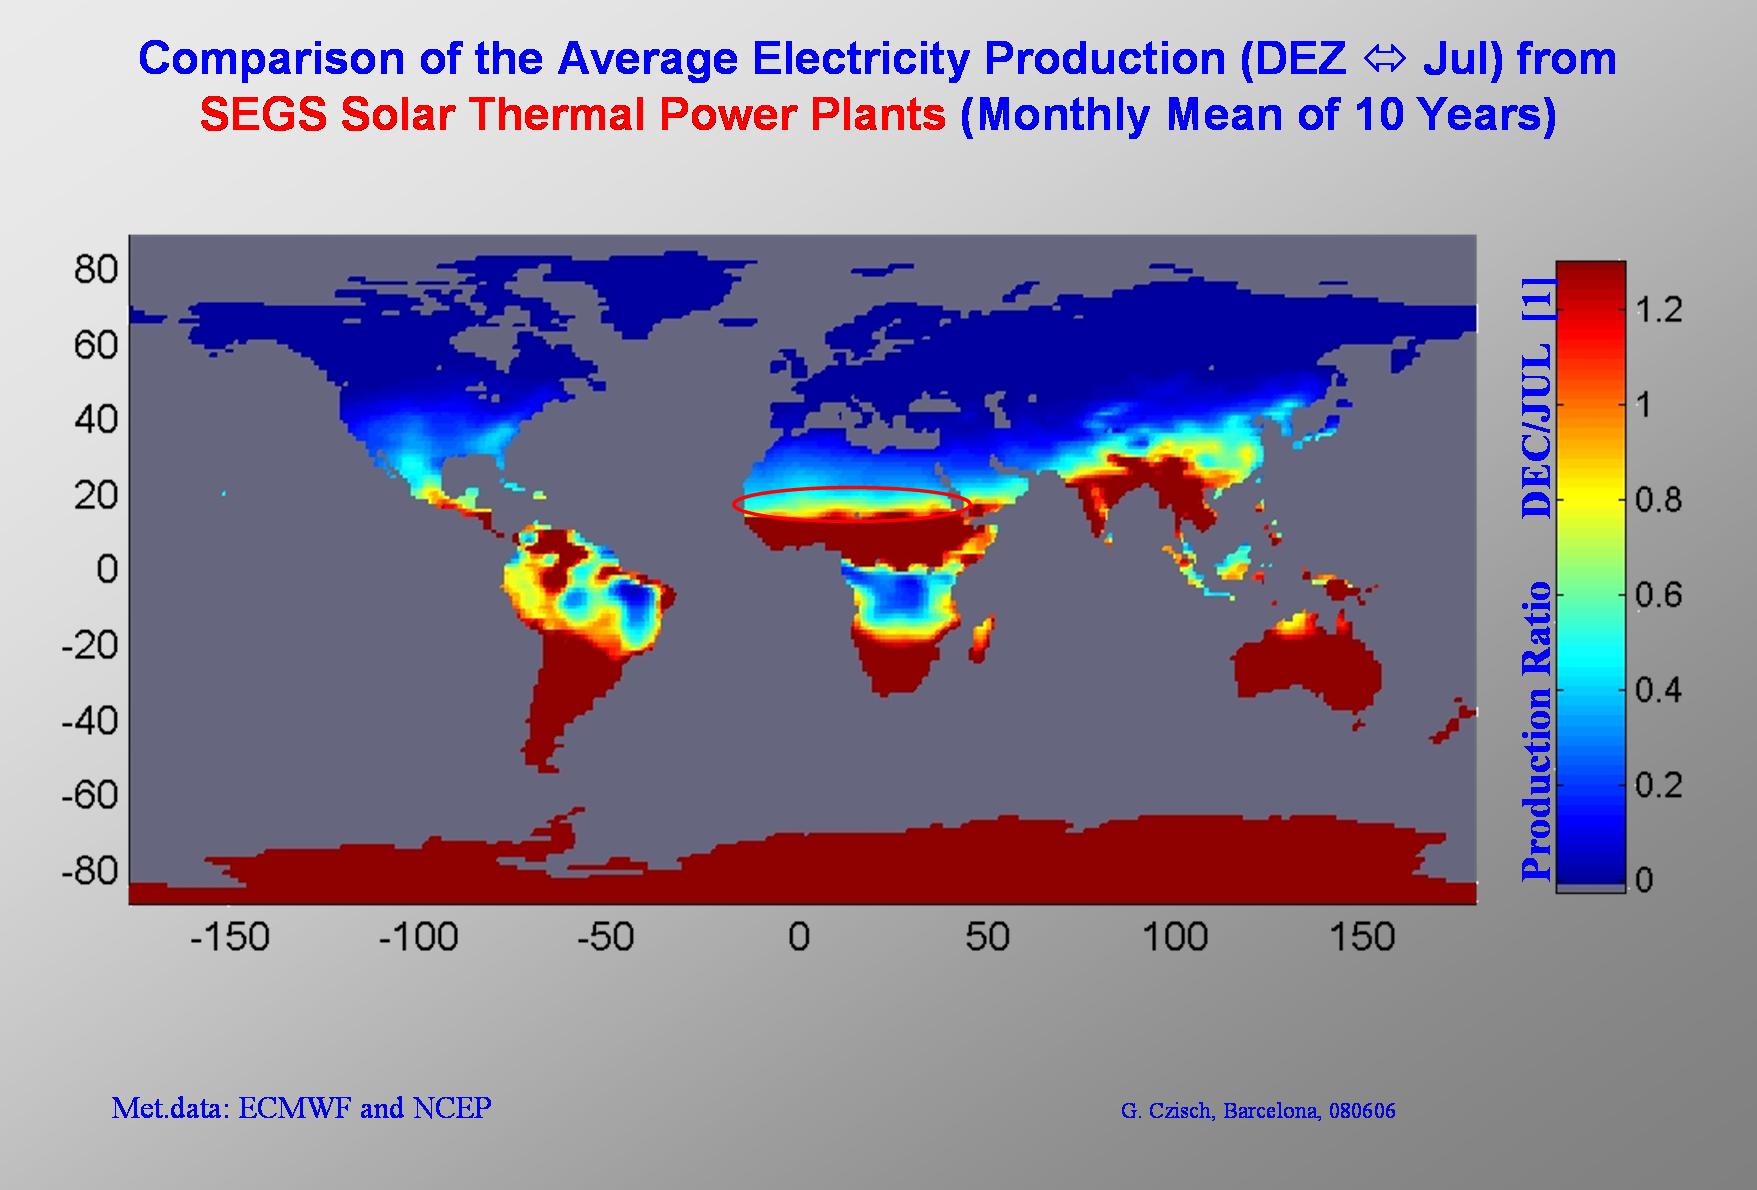
The seasonal variation of power production from SEGS power plants is significantly smaller at lower latitudes.
On this slide we can see as an example the ratio between the average electricity production in December and July. As it is the case for the PV electricity production, at the southern Sahara we find that the production only changes slightly over the months while the variations are much stronger going to higher longitudes. |

|
Since the electricity production with solar thermal power plants is – as we will see later – relatively cheap at good sites we can also think about transmitting the electricity from Africa to Europe. |
|
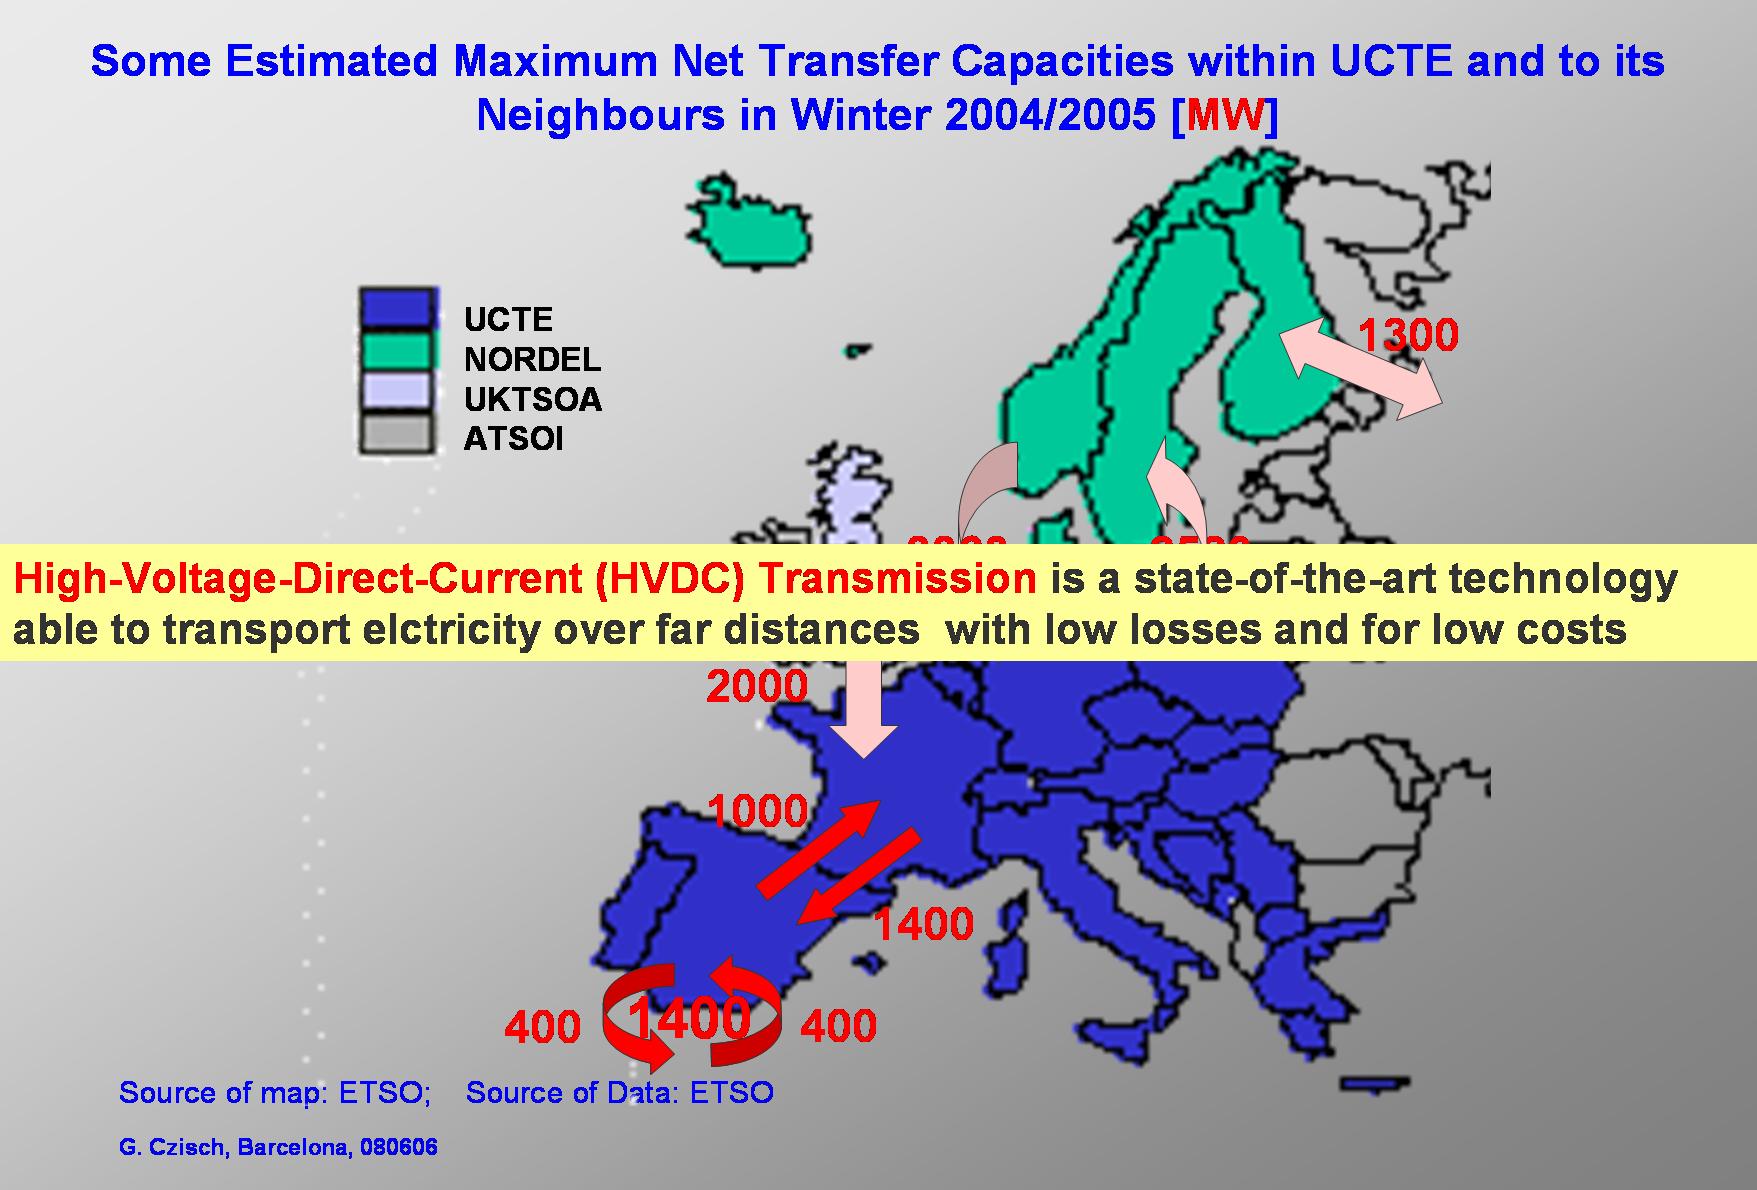
But the European electricity network within and especially between the countries is to weak for high wind power penetration or huge amounts of renewable electricity from solar thermal power plants. This is also true for the connection to Africa.
For example the Net Transfer Capacities from Morocco to Spain was 400 MW and the 1000 MW from Spain to France would not allow high power transfer and build another bottleneck even after the rated cable capacity between Spain and Morocco is enlarged to 1400 MW. But there is a solution. High Voltage Direct Current Transmission (HVDC = HGÜ) is a technology used since many decades for transmission of huge amounts of electricity over far distances at very low losses and low costs. |
|
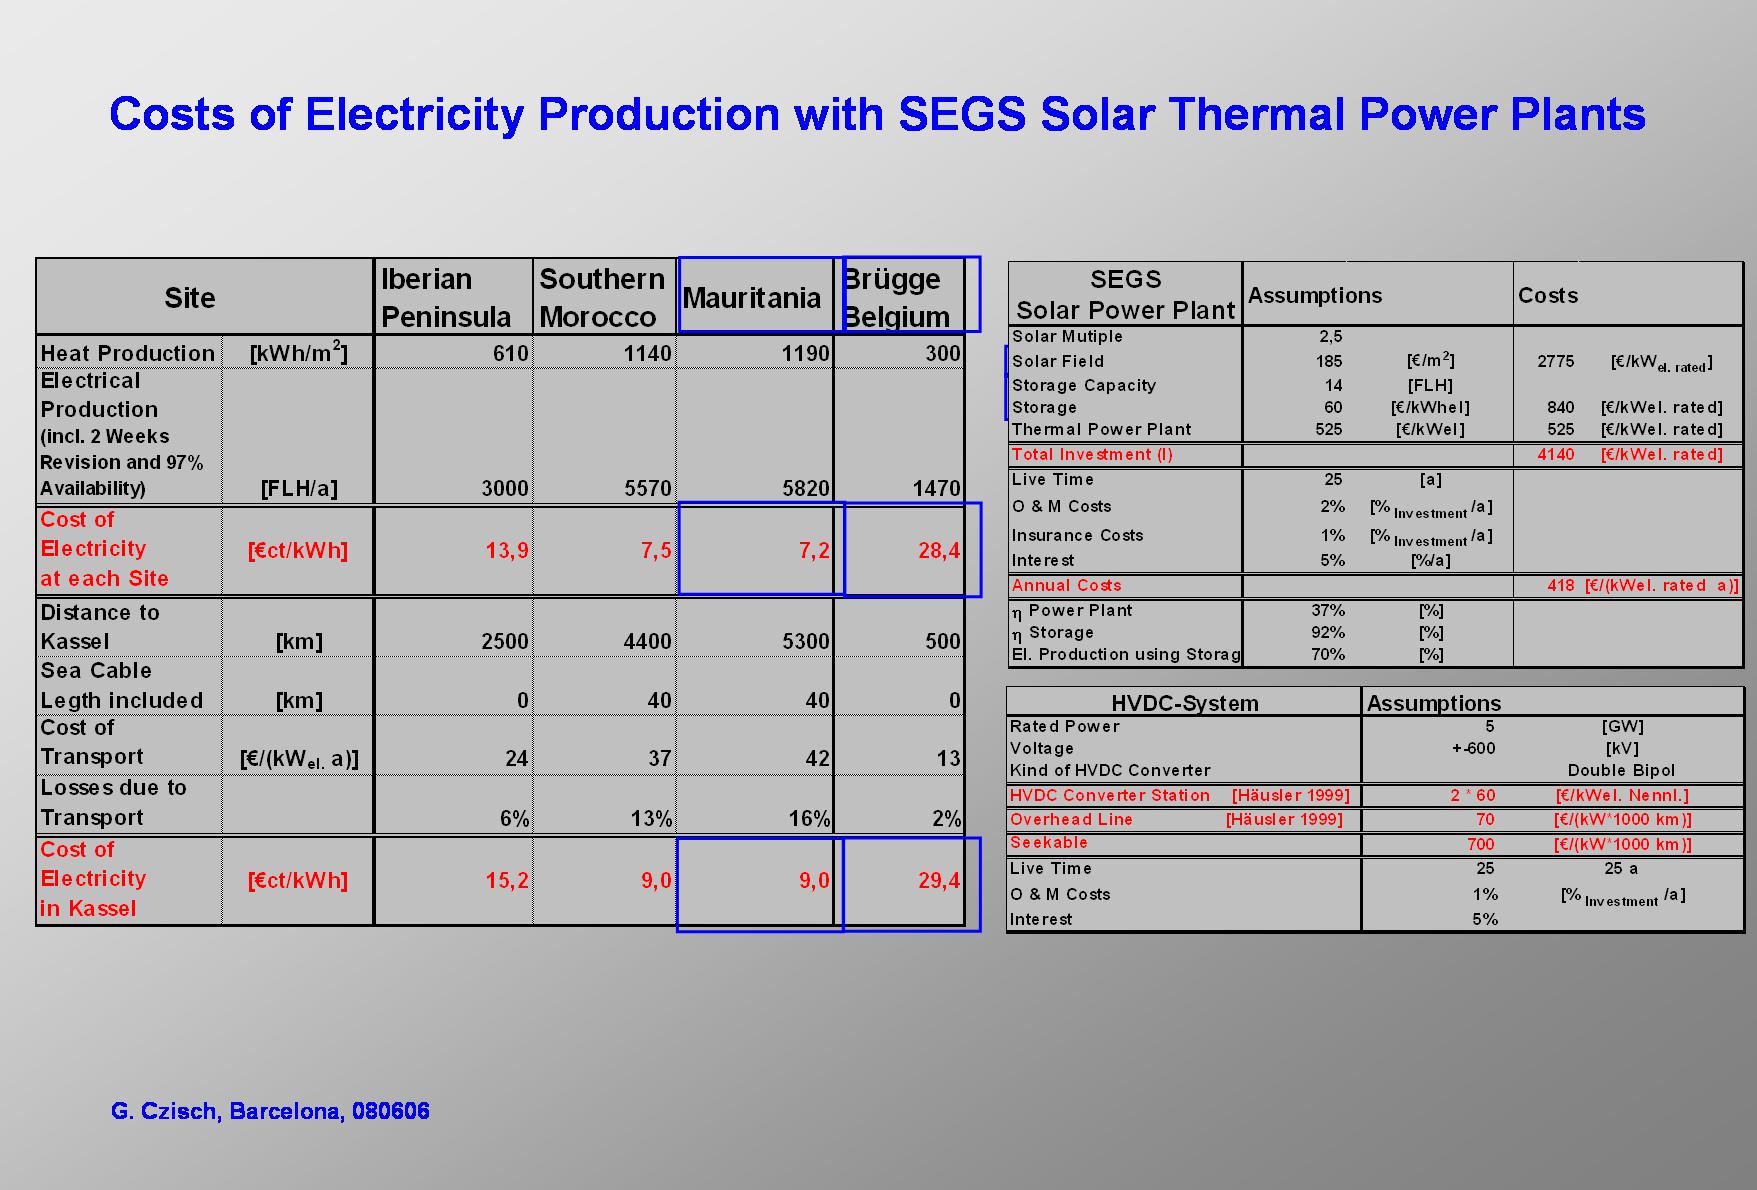
With the underlying economical assumptions based on today's technologies and prices shown in the upper right table the costs of solar thermal electricity production are calculated for some selected sites. The size of the solar thermal power plants is chosen to be 200 MWel. (The size matters because of scaling effects.) The results of the cost calculation are listed in the table at the left side. (The cost assumption for the power plants are mainly based on information of Dr. Franz Trieb of the DLR Stuttgart.). Comparing the costs of electricity in the Iberian Peninsula with the current feed in tariff for electricity from solar thermal power plants in Spain raises the question if the costs of solar thermal power plants might not be higher than the figures calculated with here. The feed tariff in Spain is 26 €ct/kWh paid over 25 years. The calculations depicted in the table show costs of 14 € cents/kWh at a production of 3000 full load hours. The feed in tariff is more than 80% higher than the calculated costs in our example. The Andasol power plant in Spain is estimated to run at 3500 full load hours. So it might be erected at a better production site than the site selected for the calculations. This might ad another cost difference of more than 10% on top of the feed in tariff. This altogether is not a negligible cost difference which might indicate higher present costs than used for the calculation and for the scenarios we will see later. The reasons for the difference would be worth to be studied in detail. Parts of them can be explained by scaling effects since the power plants in Spain are not allowed to exceed 50 MWel. A further explanation might be higher costs of capital possibly caused by high returns on equity and high equity shares. Another part of the explanation might be found in higher costs of materials since they grew since the first years in this century for many materials.
Using today's High Voltage DC (HVDC) technology to transport the electricity to Europe (e.g. Kassel GER) the costs of electricity would even for the furthest distance mentioned only increase by 30% compared to the calculated costs of production at the power plants site. The underlying economic assumptions for HVDC technology are shown in the lower right table. The costs of electricity in Kassel do not seem to be unreasonably high. The option to import solar thermal electricity from Northern Africa to Europe becomes even more interesting, if the investment costs for solar fields, the most costly part of SEGS power plants, will reduce. An reduction to roughly 50% of the today's field costs is expected as soon as a capacity of 7 GW of SEGS is erected world-wide – based upon estimations of the DLR Stuttgart. This will reduce the costs of electricity in Kassel to approx. 60% or below 6 € cents/kWh . |
|
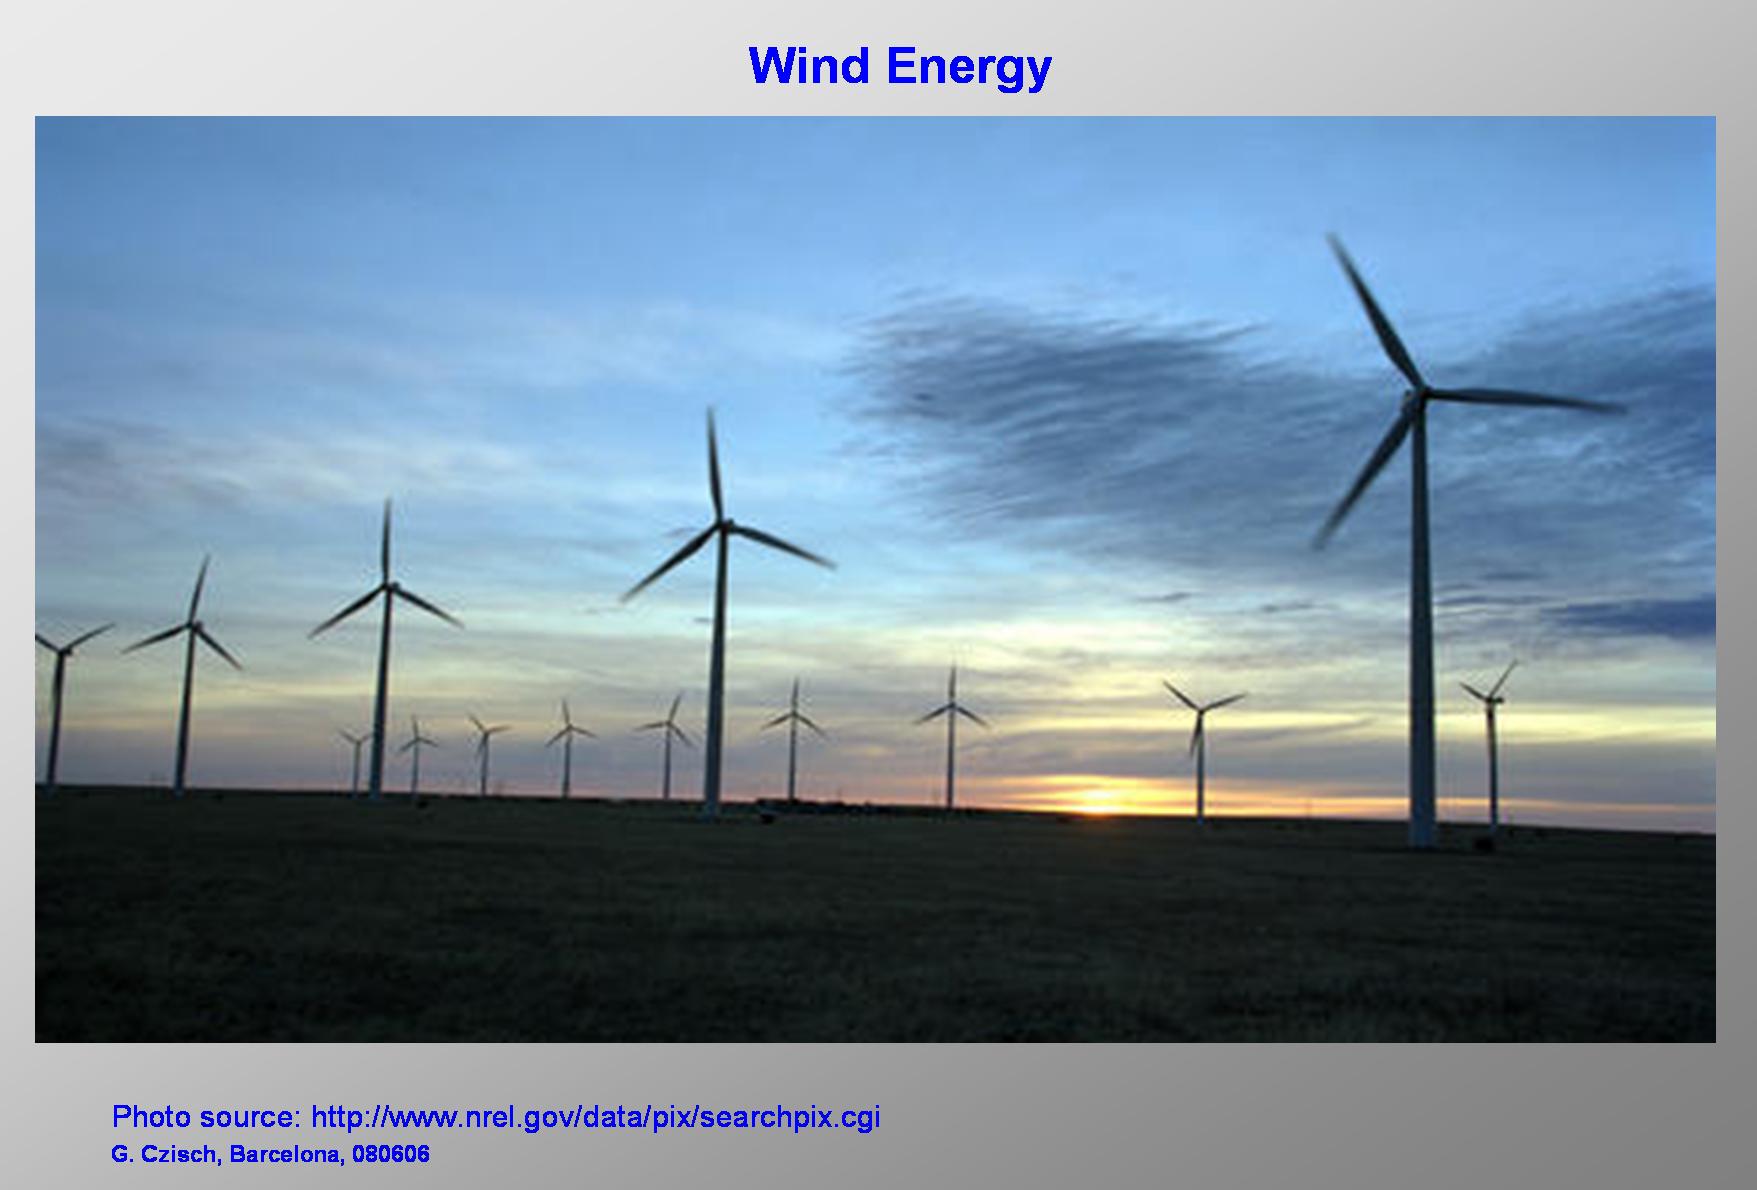
Now we come to wind energy which today may be the most attractive and promising way of renewable energy use. |
|
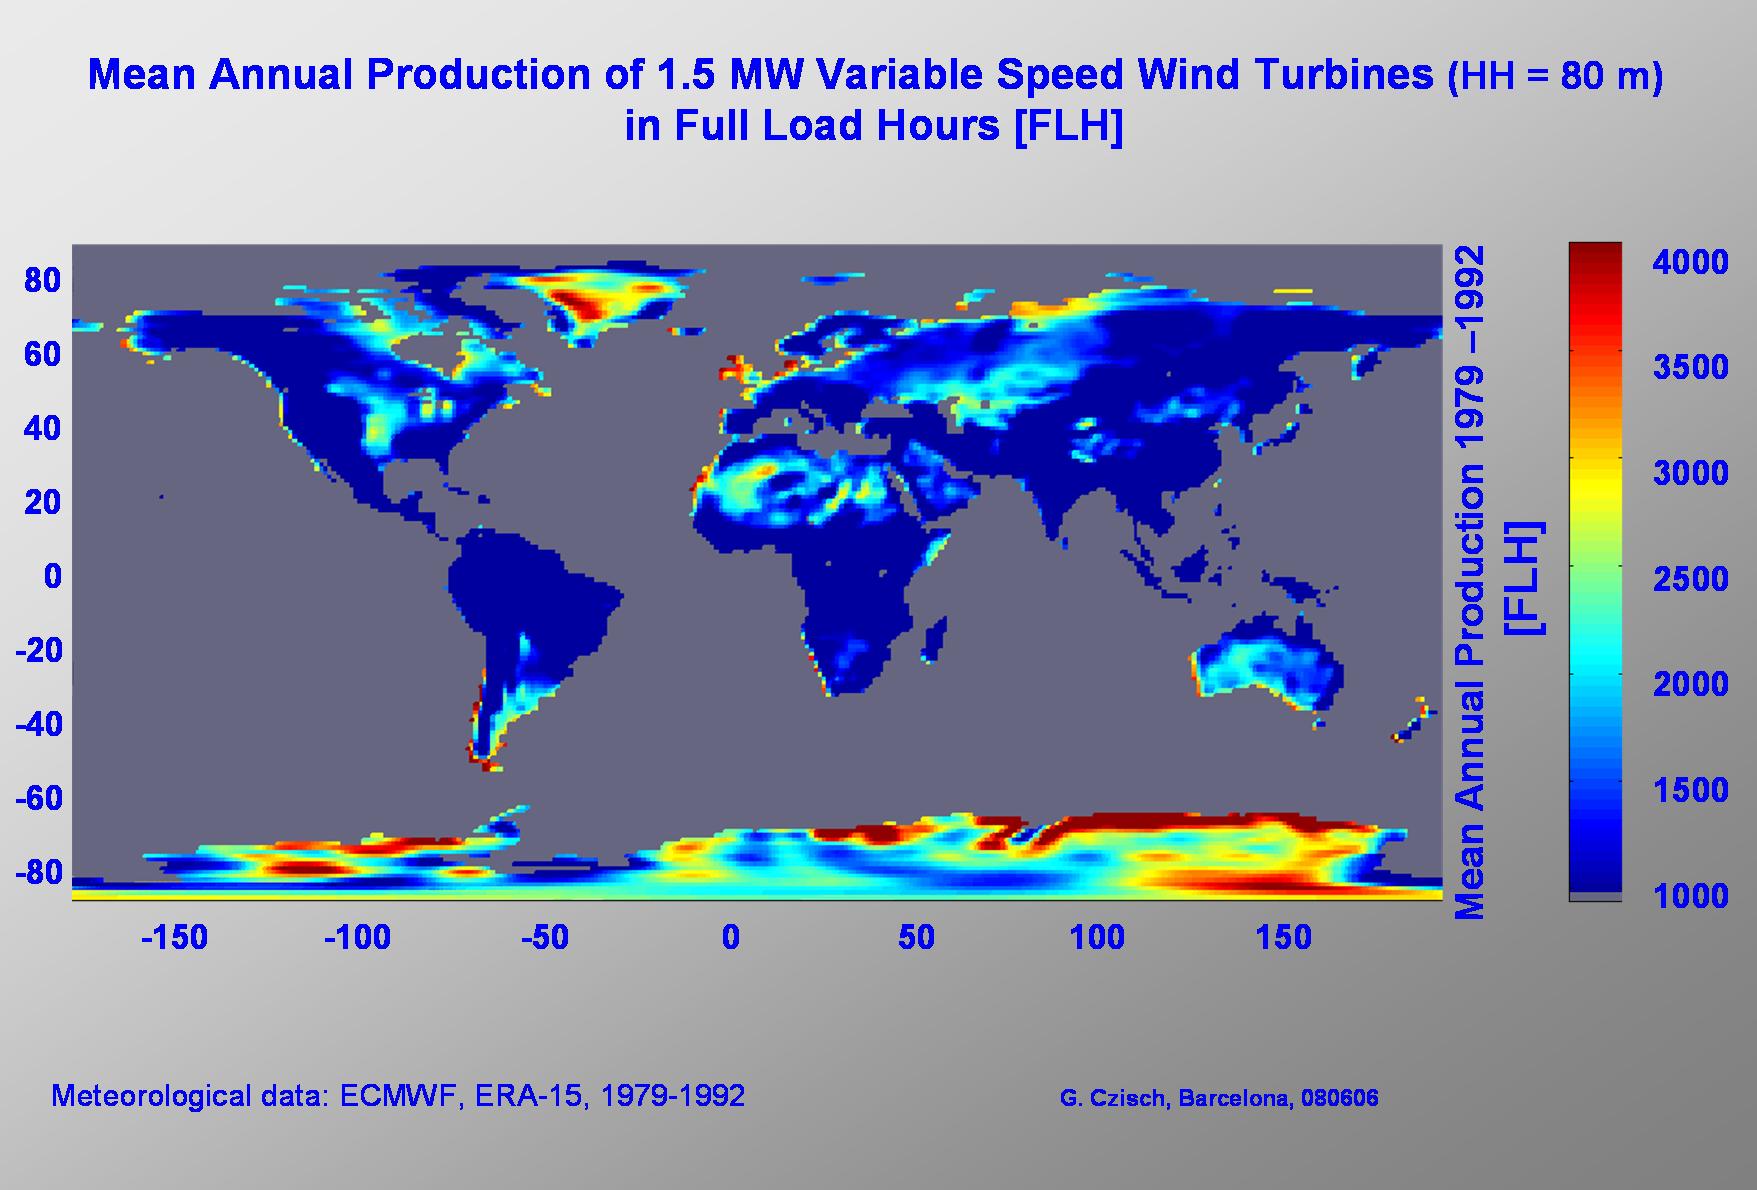
Here we see the potential production of wind energy calculated from data of the European Centre for Medium Range Weather Forecast (ECMWF) expressed in FLH (Full Load Hours) (the data have a spatial resolution of 1.125 degree). Europe itself has good wind conditions. But its use is limited by the high population density. But in a belt 4000 to 5000 km away from Kassel (Germany) there are also very good wind conditions and in most of the areas the population density is 2 orders of magnitude smaller than for example in Germany. |
|
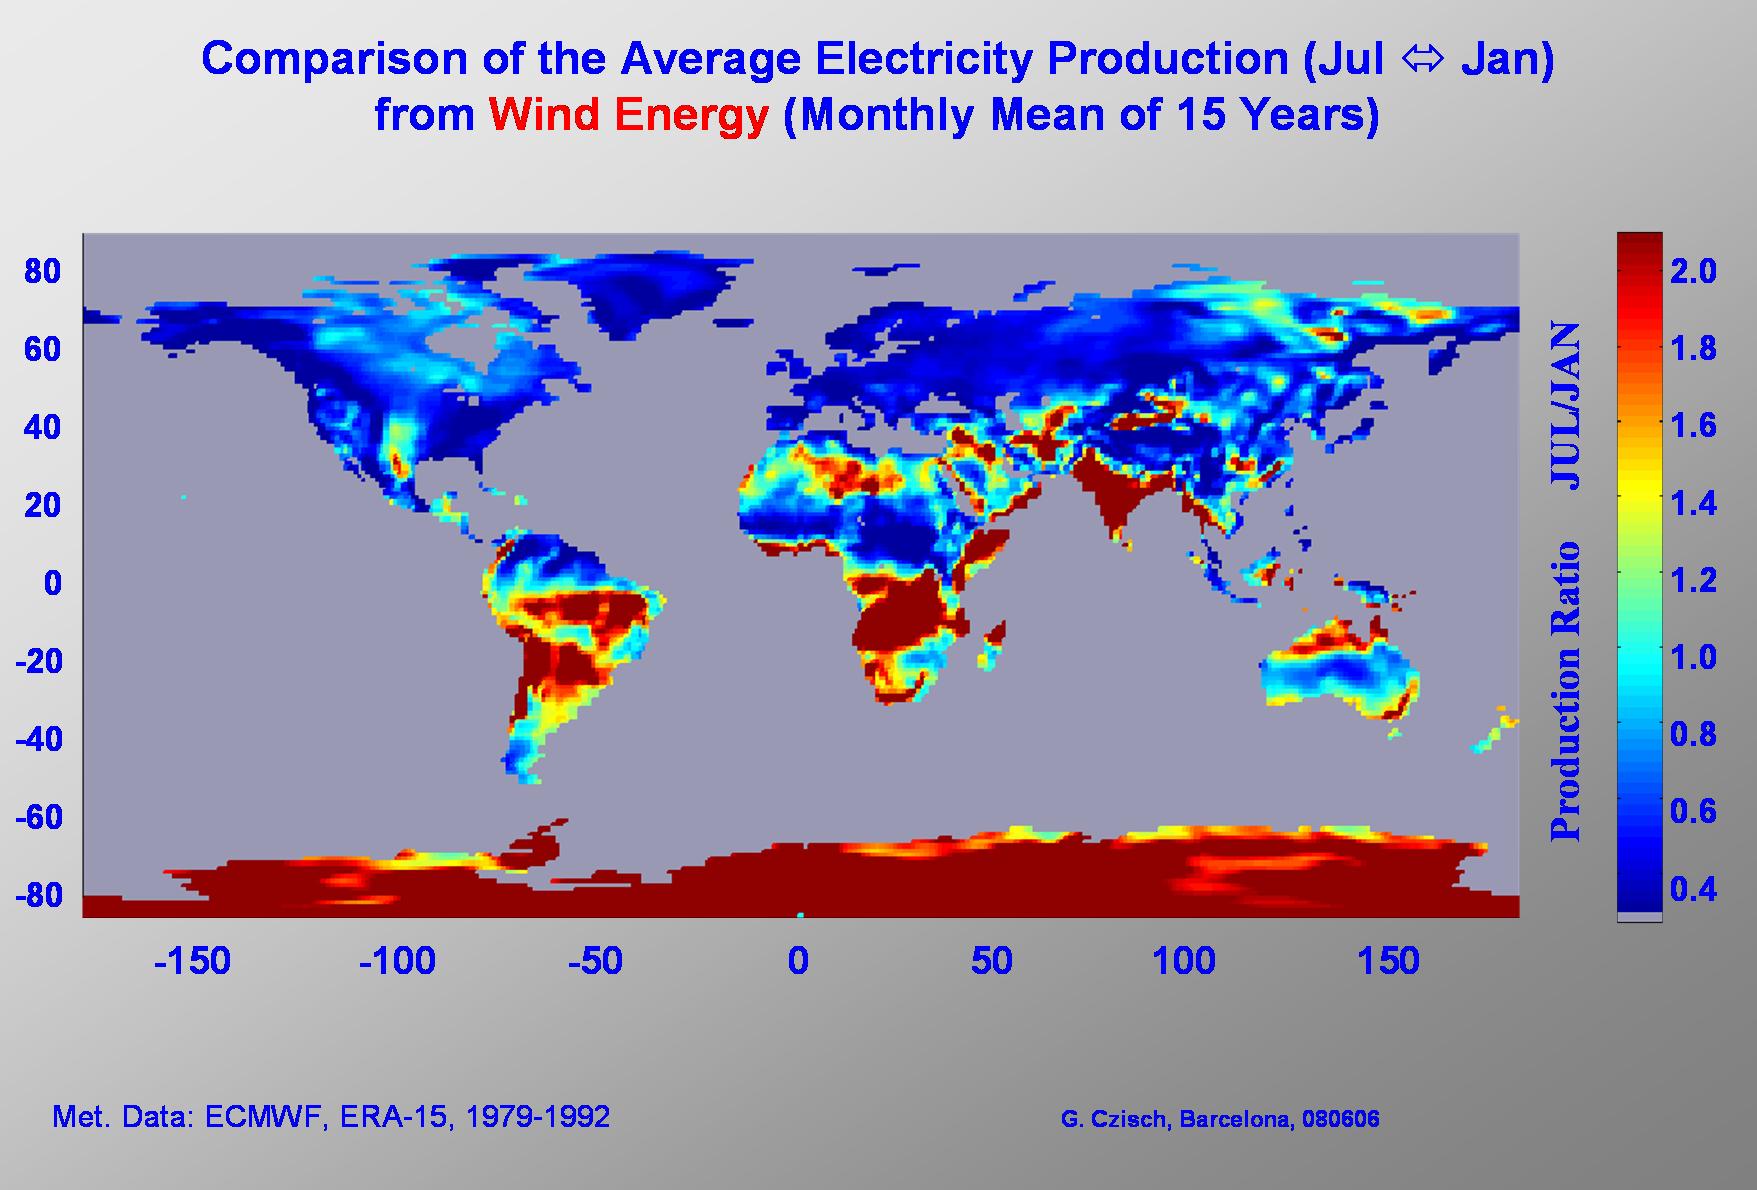
The seasonal variation of the potential power production from wind energy shows significant differences in different regions.
On this slide you can see for example the ratio between the average electricity production in July and January. We see, that Europe is a typical winter wind region with maxima in winter and minima in summer. While for example at the Saharan west coast we find maxima of the production in summer. In some other regions the production in July and January are quite similar. So the idea of selecting the regions in order to get the best match of production and electricity consumption suggests itself. |

|
If we now zoom in and have a view on Europe and its neighbourhood we find the potential production within the shown area only considering sites with more than 1500 FLH (this is about 40% of the land area shown) is about 100 times higher than the Need of the European Union (EU-15) and Norway or 50 times the electricity consumption of the whole area. (If the best wind sites within the area – according to the ECMWF data used – would be selected till the annual production is equivalent to the annual electricity consumption in the area shown there must be installed wind energy converters (WEC) at roughly 0.4% of the land area shown. About 1% of this area or 0.004% of the total area would then be covered by streets and other infrastructure for the WECs. This is a relatively small fraction if compared e.g. with the area used for different kinds of infrastructure today. In Germany the fraction is about 6% of the total land area which is about 1500 times as much.)
It is possible to be quite selective and choose only the better regions. As an example I selected the following.
To use these potentials we have to have high transport capacities. |
|
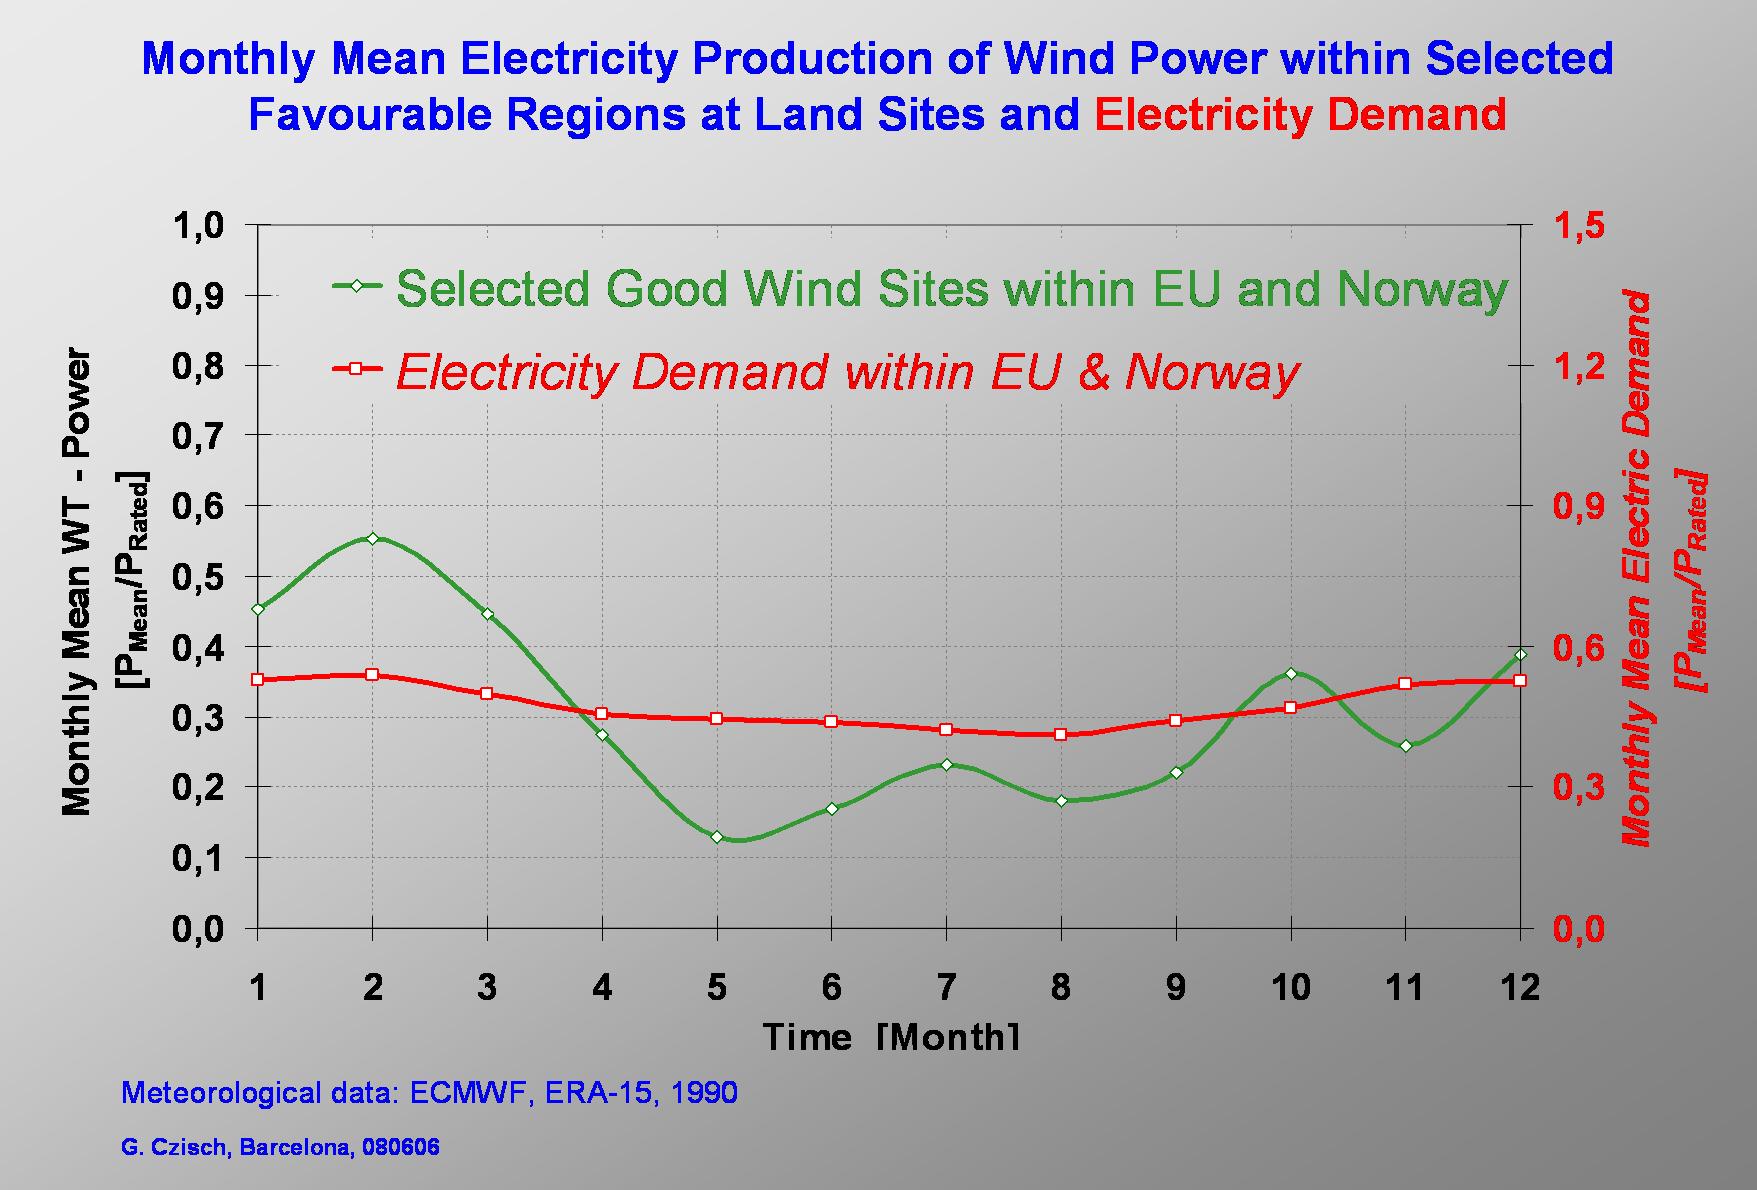
Now we look closer to the five selected regions.
Comparing the monthly mean wind power of the selected European regions and the demand of the EU & Norway one can see that the fluctuations of the production varies much more than the demand. Europe is a typical winter wind region with maxima in winter and minima in the summer month. To deliver all the monthly electricity need from wind energy would either necessitate huge storage capacities to store the seasonal over production for times with under production. Or it would be necessary to over install the wind capacity in such a way that even in the month with the biggest potential deficit of electricity from wind energy will be produced enough. But for the first approach there must be huge storage capacities available not al all existing today and the second approach would lead to a huge excess production and very high investments. |
|
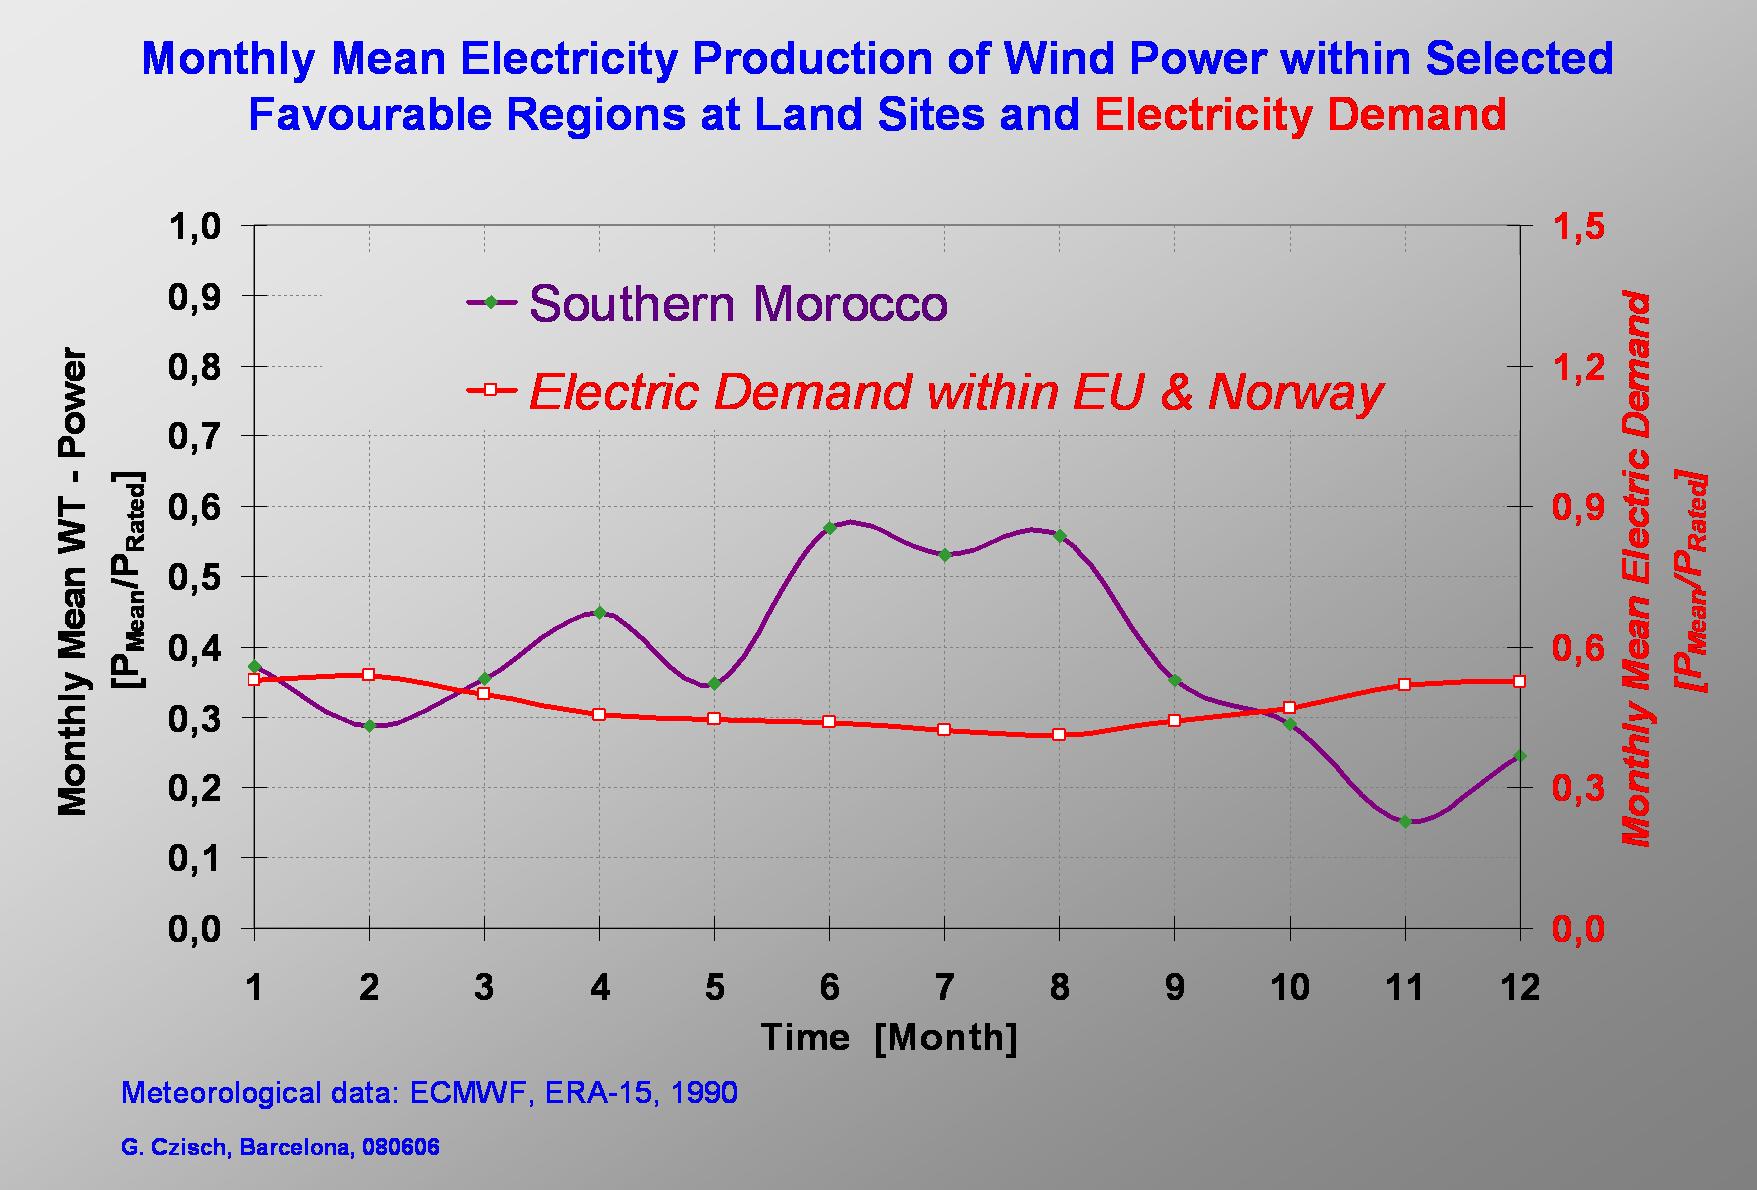
Also the monthly means in Southern Morocco vary much more than the demand, but it is a trade wind region with summer maxima. |
|
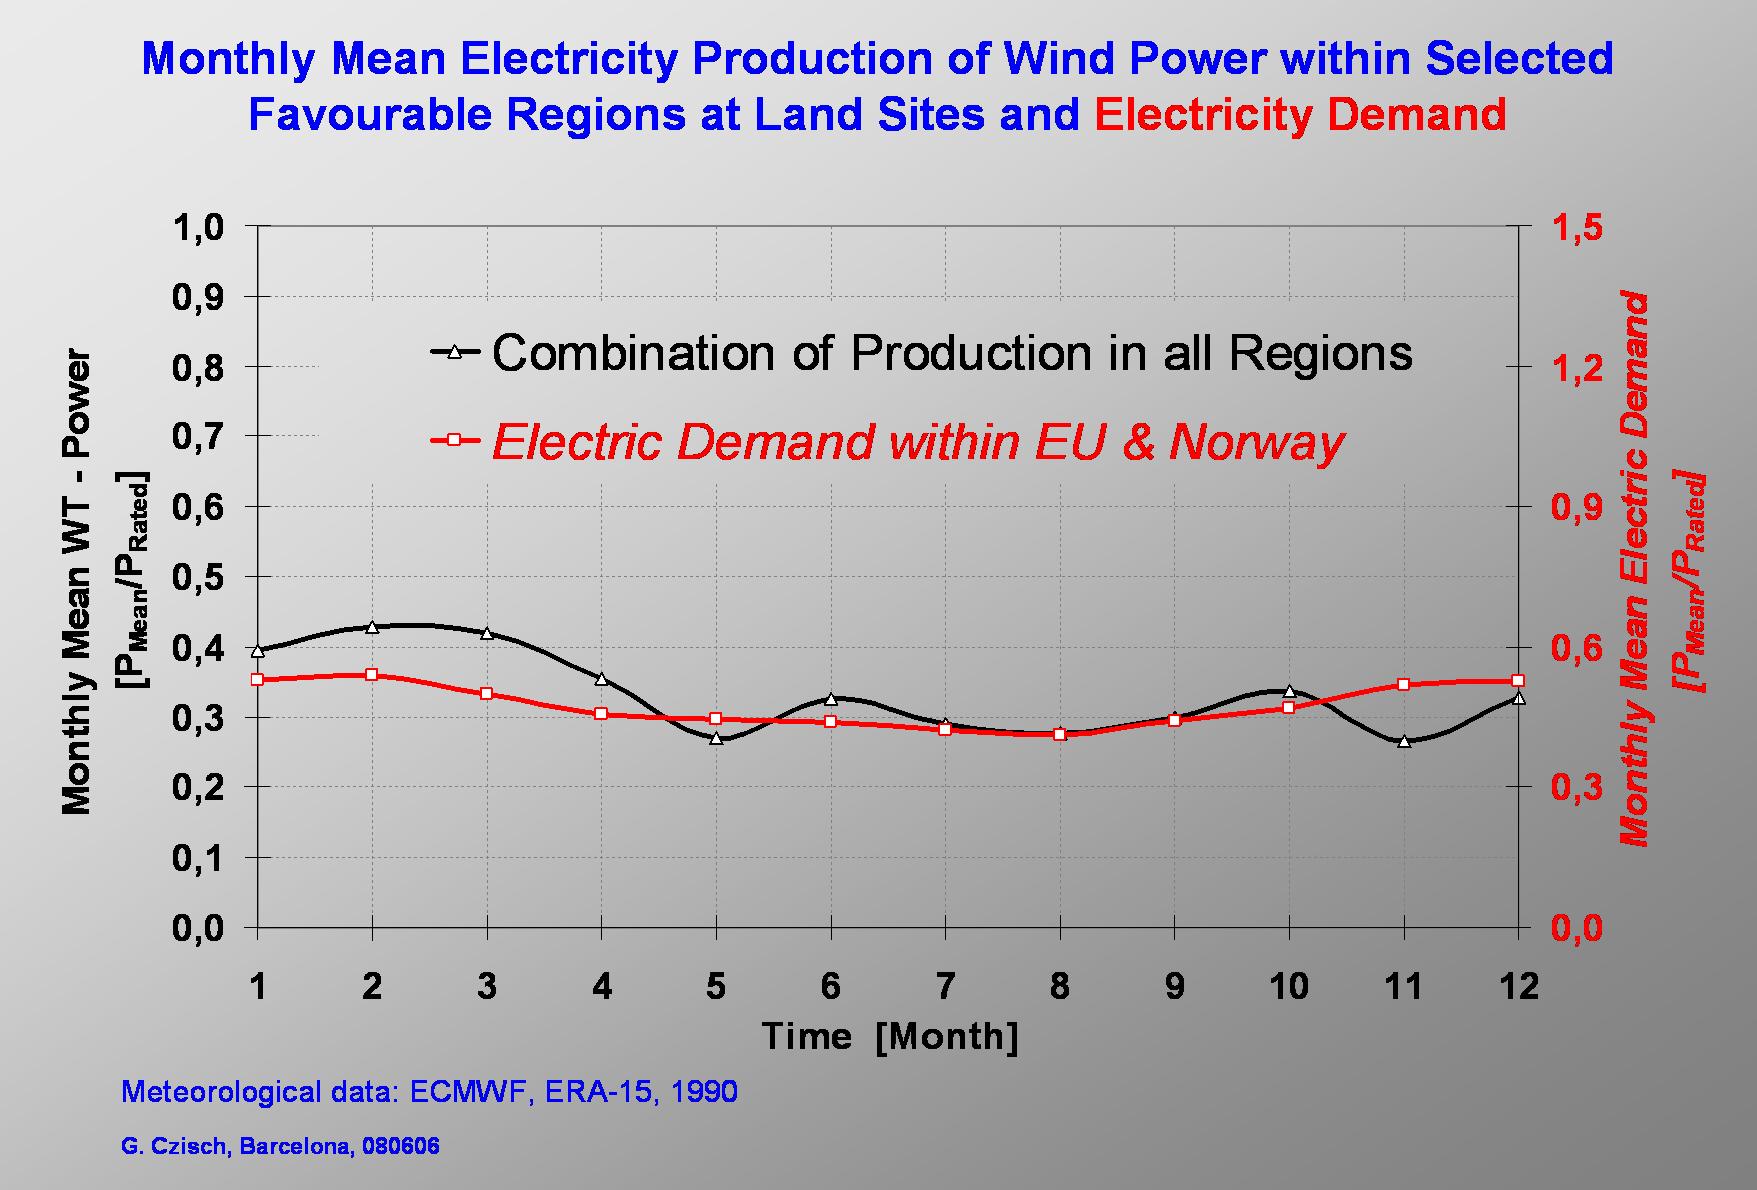
It is obvious that the use of simultaneous production in different regions can much better fit the demand. This shows the black line which represents a combination of of the five selected regions. Furthermore not only the long term behaviour changes with the size and selection of the catchment area but also the short term fluctuations are smoothened.
A Tran-European cooperation therefore would dramatically reduce the storage needed as well as the total capacity of wind turbines. |
|
Scenarios for a future electricity supply
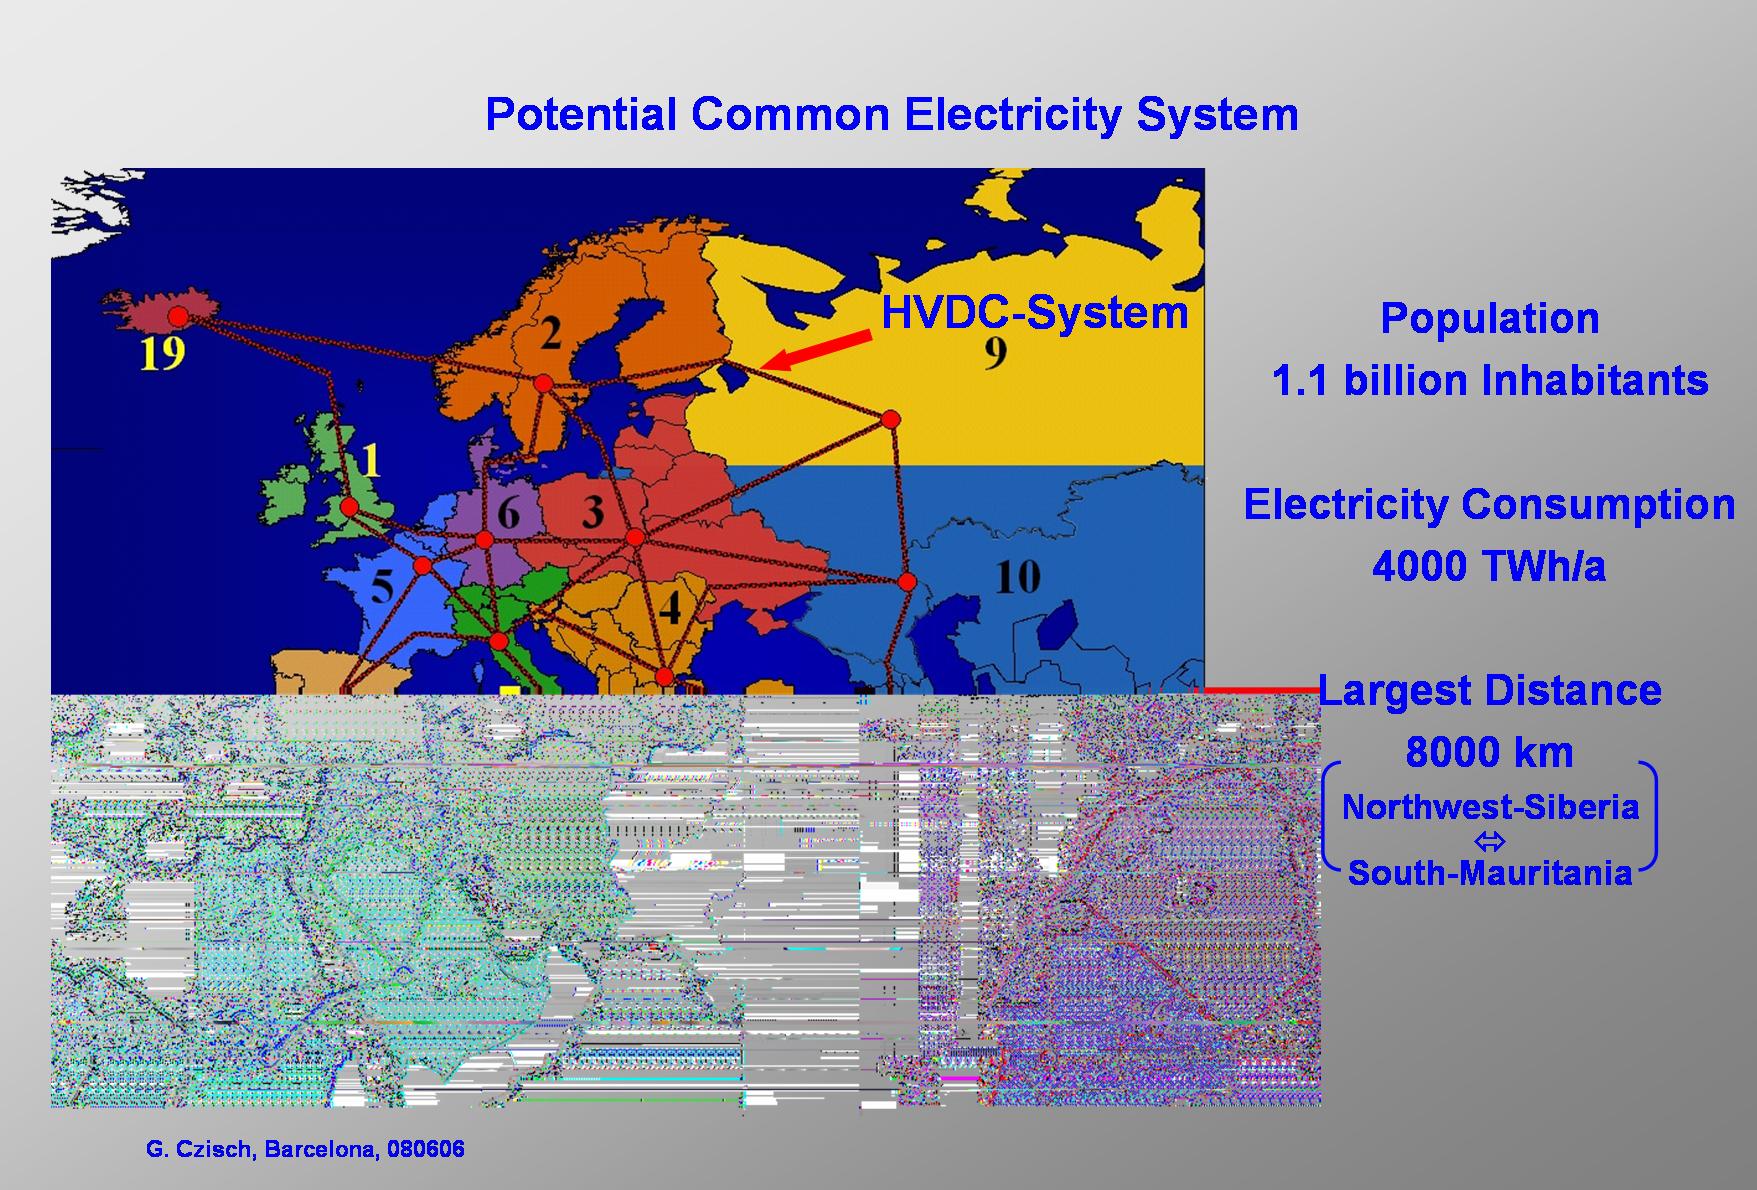
Scenarios for a future electricity supply entirely with renewable energies have been developed for the region shown in this figure. The supply area contains approx. 1.1 billion inhabitants with an electricity consumption of roughly 4000 TWh/a. This part of the world has been analysed to determine the available potentials for a future electricity system. Various concepts have been studied for providing renewable energies to Europe and neighbouring regions. This process has taken into account ECMWF data as the main meteorological basis and the population density as a restrictive factor for the wind energy potentials or estimated roof areas in all countries within the shown regions for determining the roof top photovoltaic potentials, combined with data on solar irradiation, wind speeds, and also temperatures used e.g. for photovoltaic electricity production and for solar thermal electricity production. Also other renewable resources such as biomass, geothermal potentials and hydropower have been investigated or included at the level of current knowledge. Mathematical optimisation routines have been applied to the question of which renewable resources with their individual temporal behaviour at different sites and with different yields should be used, and how selection should be made to achieve optimum cost performance. (A linear optimisation with roughly 2.45 million restrictions and about 2.2 million free variables was employed to find the best combination in each scenario.). The optimisation takes into account the temporal behaviour of the combined consumption of all countries within every individual region shown here as well as all requirements imposed by resource-constrained production. Both sets of data, electricity demand and temporal behaviour of the possible production, have been compiled for optimisation (using time series with three-hour intervals) for all of the 19 regions to be supplied with electricity. The optimisation process ensures that supply will meet demand at any time, while determining if and to which extent any potential source is to be used, and how every part of the supply system will operate, including the dimensioning and operation of a HVDC grid that is superimposed on the current grid infrastructure. The criterion of optimisation is the minimization of overall annual costs of electricity when fed into the regional high-voltage grids, enabling these costs to be compared directly with those from regular power stations feeding into the conventional AC-high-voltage grid. |
|
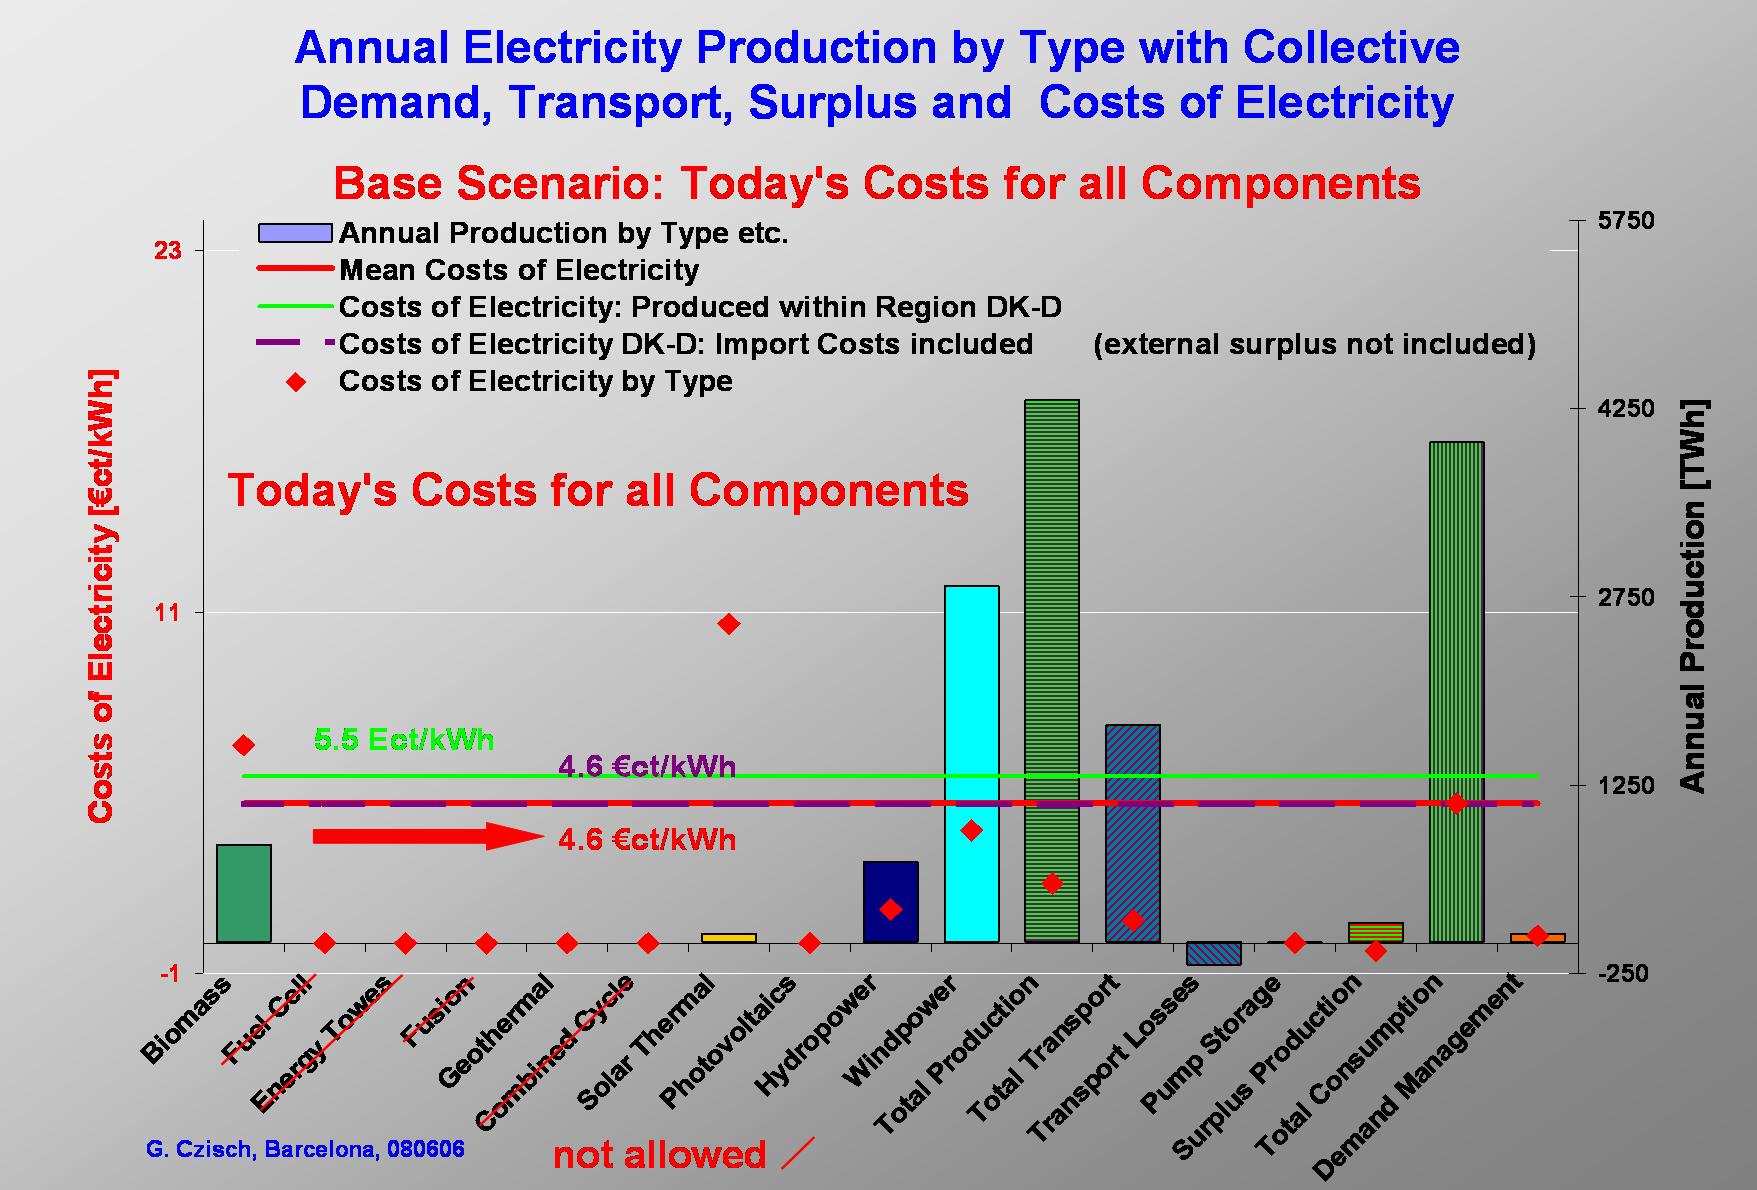
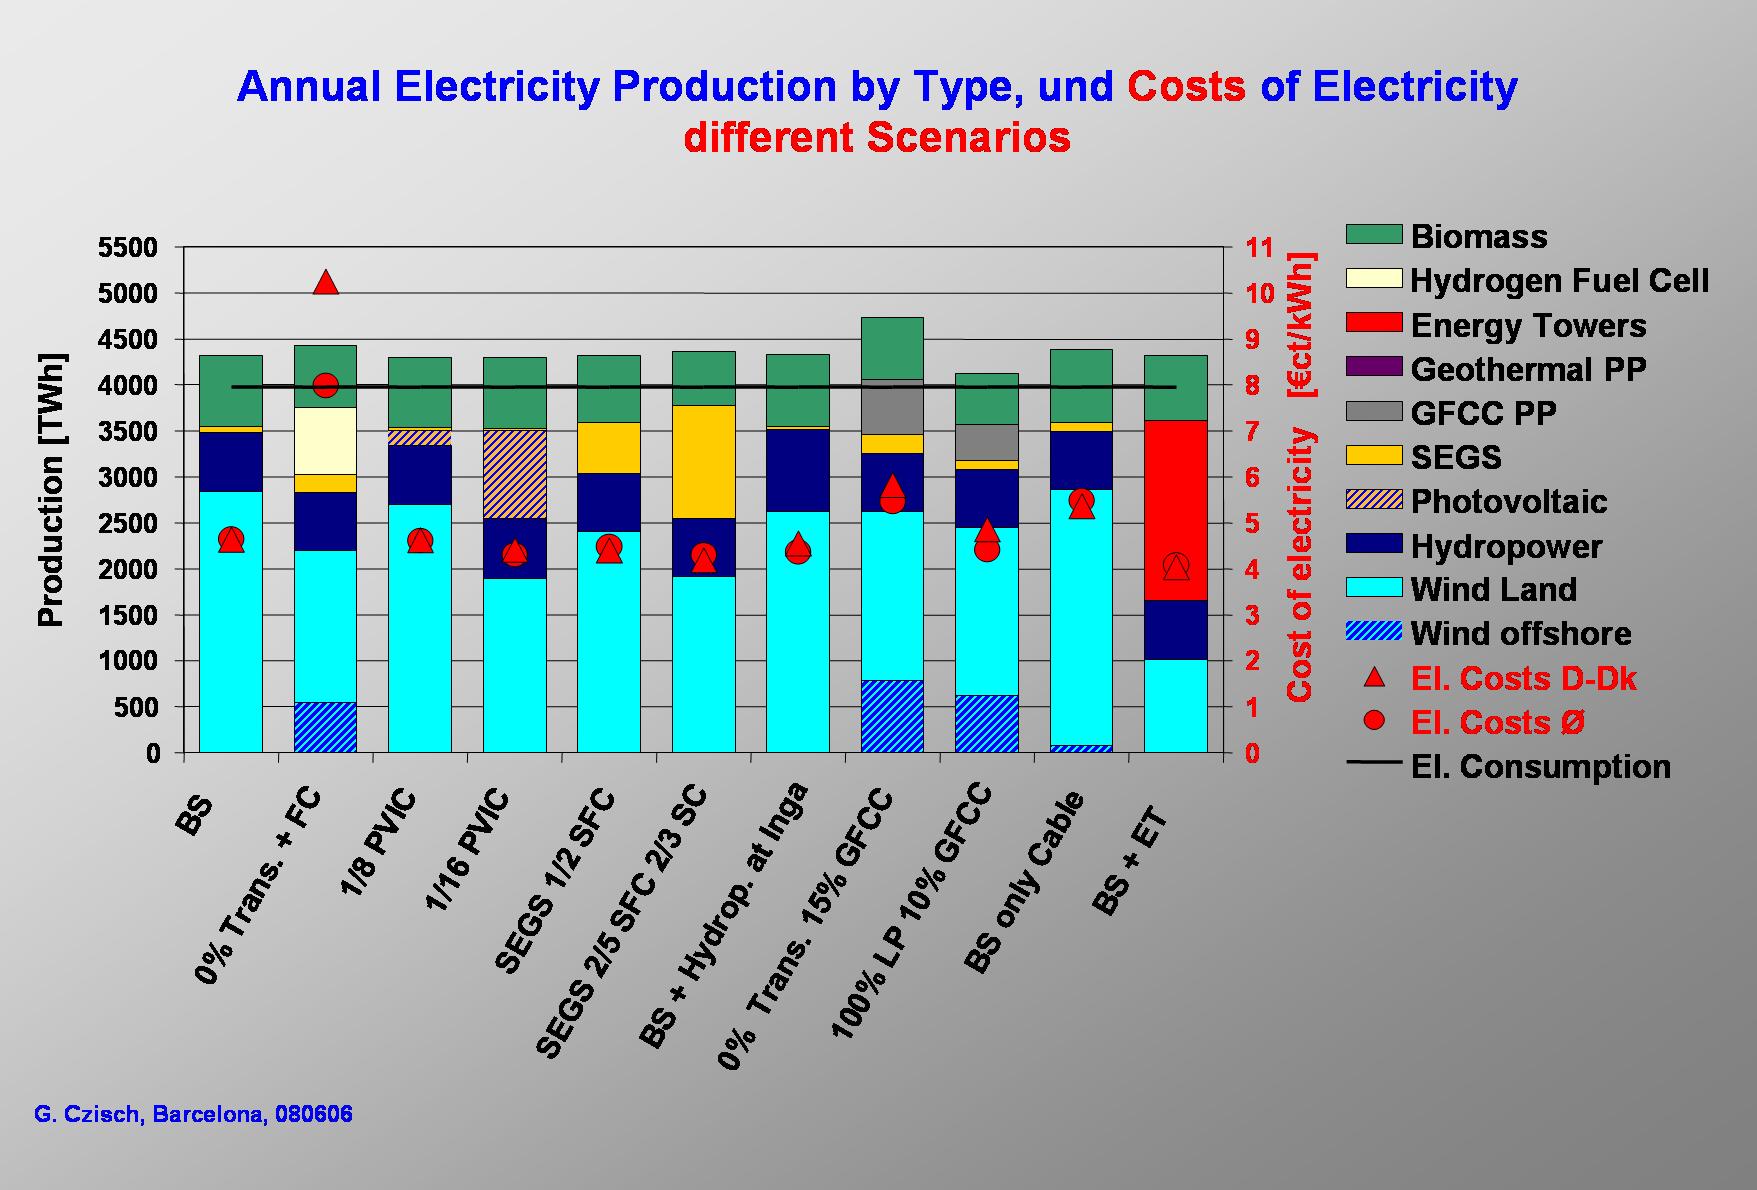
Base Case Scenario The promising results for the base-case scenario – which assumes an electricity supply system implemented entirely with current technology using only renewable energies at today’s costs for all components – indicate that electricity could be produced and transported to the local grids at costs below 4.7 €ct/kWh, which hardly differs from the case of conventional generation today. (At gas prices in 2007 of about 2.89 €ct/kWh (8.04 €/GJ) for industrial consumers in the EU-27 or 4 €ct/kWh in Germany, electricity costs from newly erected combined-cycle gas power stations calculationally had already reached significantly higher at 6 - 7 €ct/kWhel with EU gas prices or 8 – 9 €ct/kWhel with German gas prices for industrial consumers. Also the prices for cheap base load electricity e.g. at the EEX are higher than the costs of electricity in the base-case scenario and already reached more than 6 €ct/kWhel.) In this scenario, nearly 70% of the electricity originates from wind energy produced from wind turbines with a rated power of 1040 GW. Biomass and existing hydroelectric power plants provide most of the backup required within the supply area, in which the individual regions are strongly interconnected via HVDC transmission lines. Electricity is generated from biomass at 6.6 €ct/kWhel after revenues from heat sales have been factored in (in the meantime prices for biomass are risen considerably). This resulting costs for electricity from biomass lie significantly above the average price level, yet the backup capability of biomass fired power plants is essential to reduce the overall cost of the entire system. About 42% of the electricity produced is interregionally transmitted via the HVDC-System whereby the total transmission losses sum up to 4.2% of the electricity produced. Another 3.6% loss is production which neither can be consumed at the time it is produced nor be stored for later use within the pumped storage plants and therefore would be produced in excess. These two losses may be considered quite acceptable for an electricity supply only using renewable energies. |
|
It can be stated
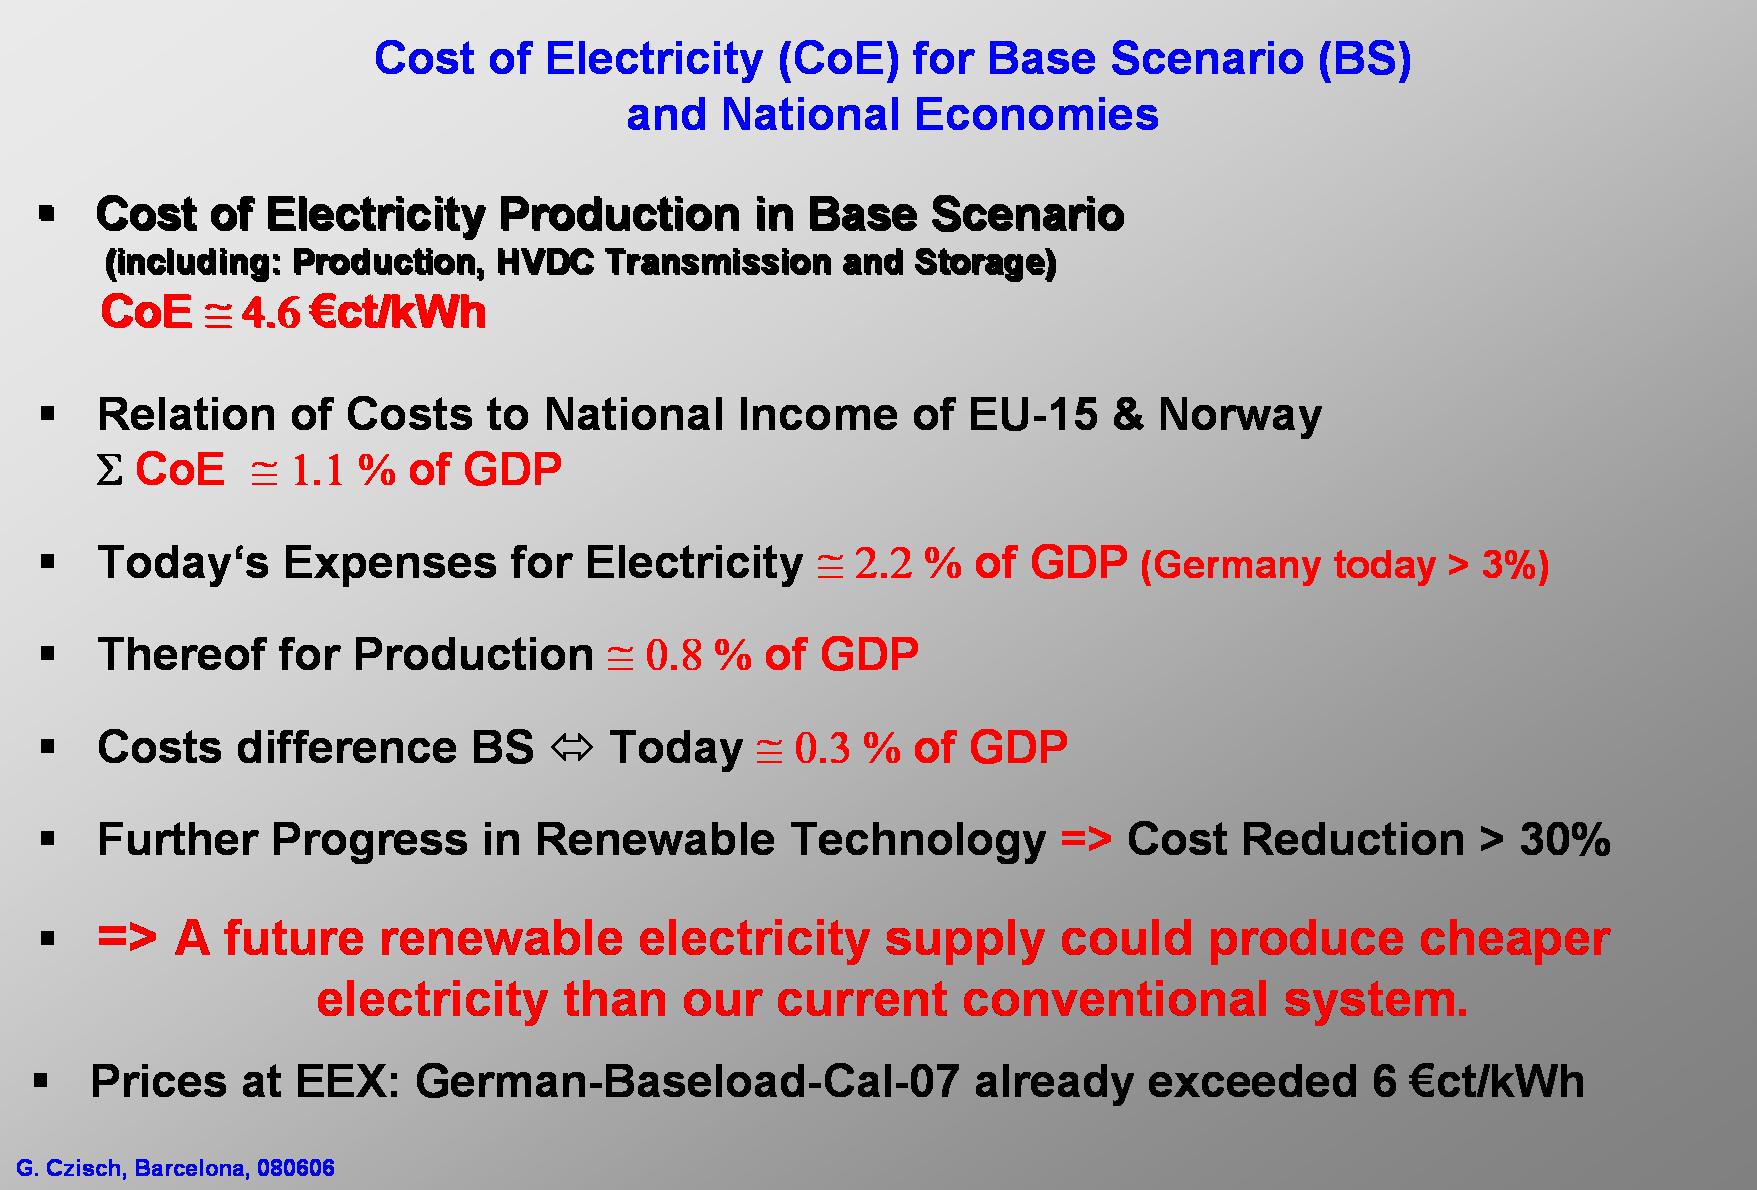
The costs of electricity don’t have to lie far above today’s costs even if very conservative assumptions are made. At today’s prices for all components, the costs of electricity don’t have to be higher than from a newly erected combined-cycle gas power plants and could be even lower than the current prices of electricity at the cheap base load electricity traded e.g. at the European Energy Exchange. The annual difference in cost compared with the current national bill for electricity, which typically may account for roughly 2 to 3% of the gross national product, would – if at all – only impose a few per mill of the gross national product as an additional burden on the industrial countries within the supply area of the scenarios, thereby constituting a highly rational alternative to the predictable consequences of climate change and declining fossil fuel resources. Foreseeable cost reductions – particularly for renewable energy technologies – make a spacious international renewable energy system both conceivable and potentially more economic than all current means of providing electrical energy. However, the costs are dependent on the future system configuration, and could be reduced by ongoing technical progress, or be negatively influenced by wrong energy policies. |
|
...] |

|
Some thoughts about the quality of the wind data used:
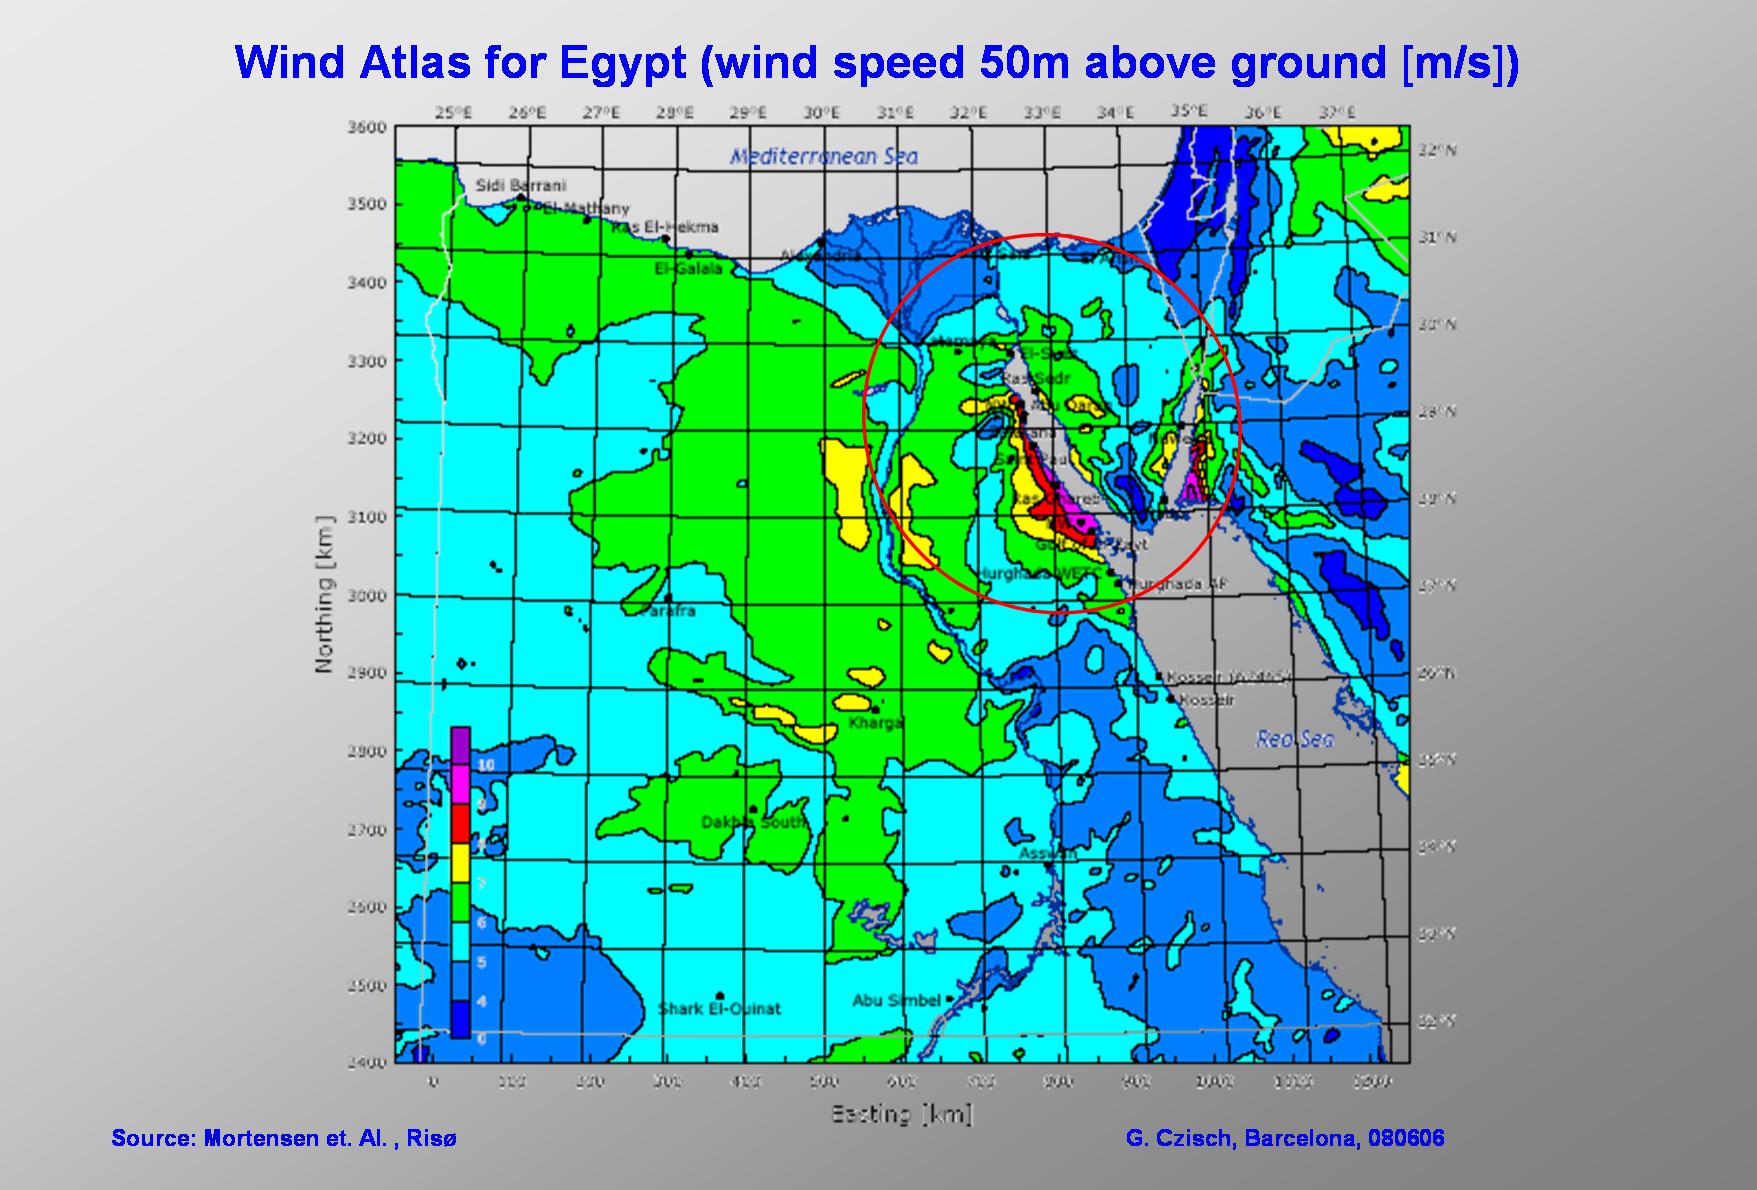
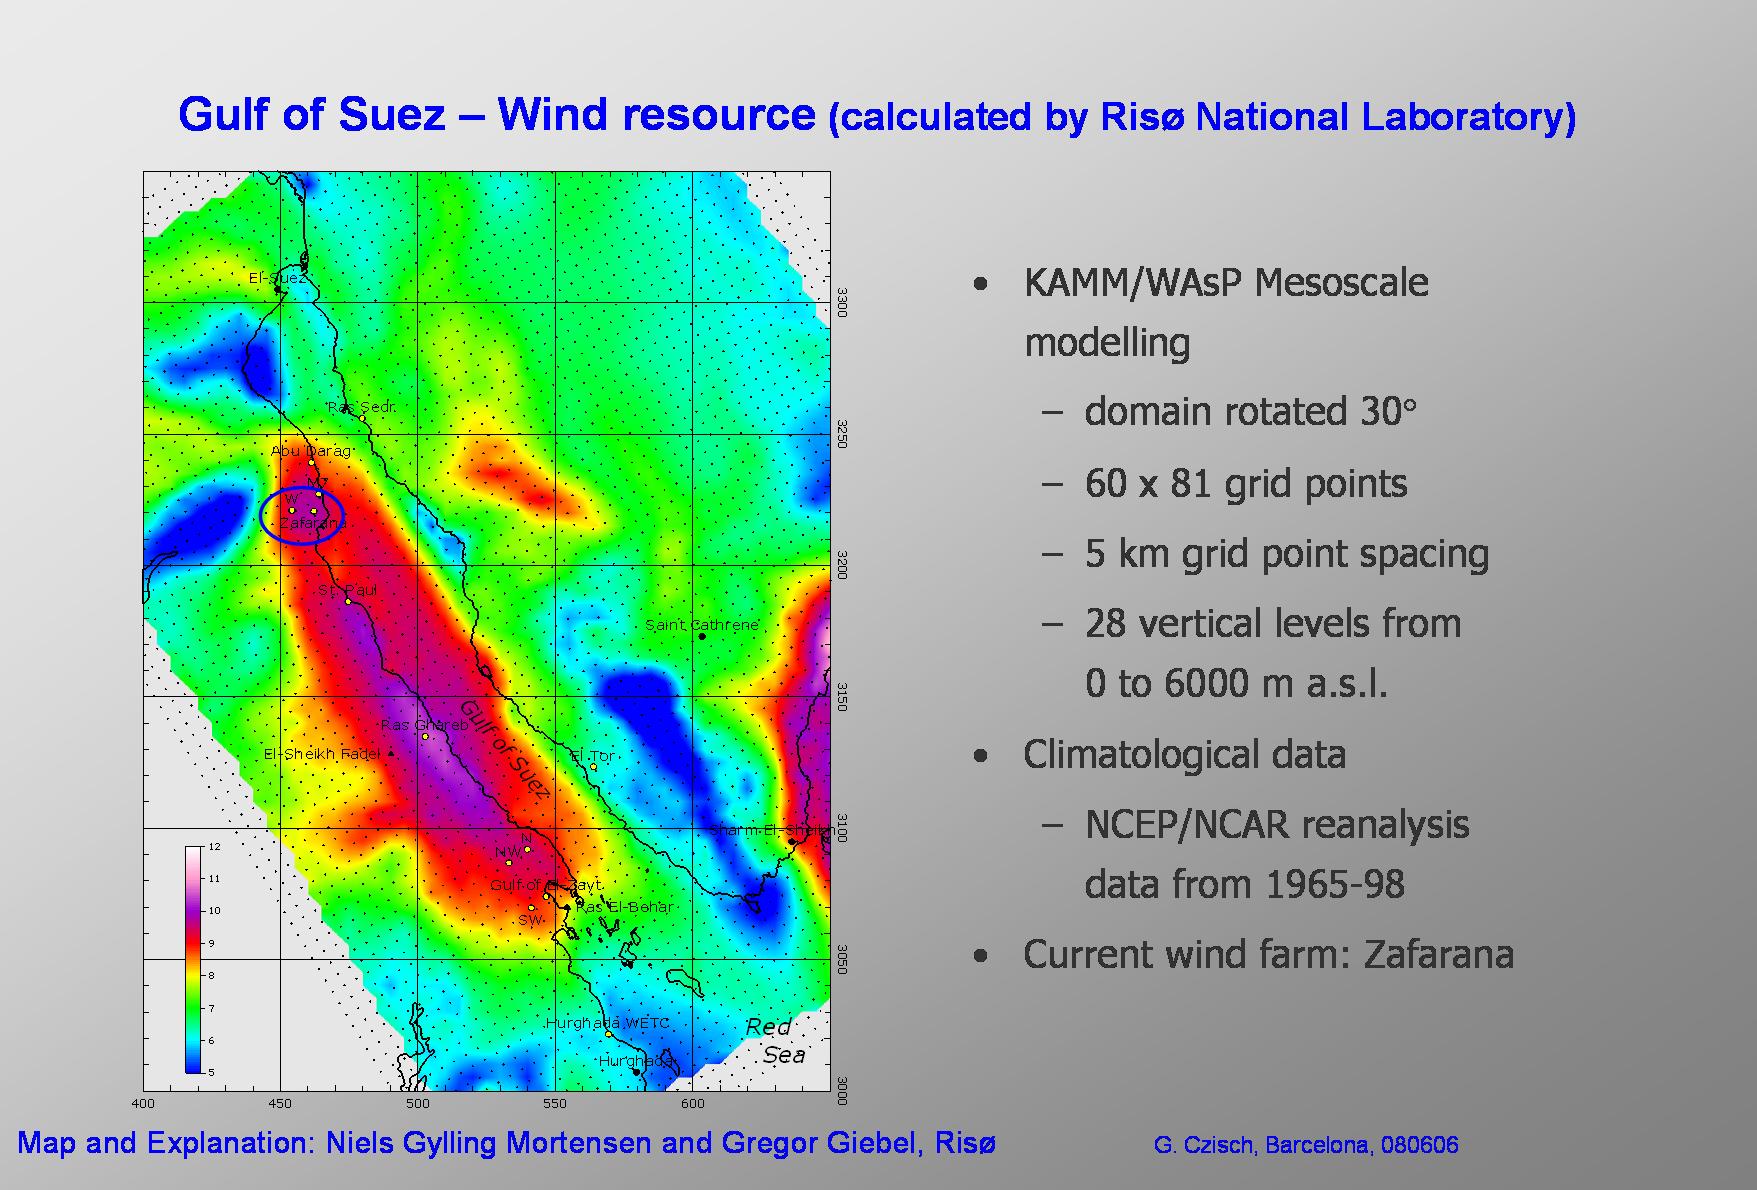
The ECMWF data used for the calculation of wind potentials and also used to provide time series of the potential wind energy production for the scenarios tend to significantly underestimate the conditions in mountainous terrain. This can be shown on a huge variety of locations worldwide. One of the most significant underestimations of the wind energy potentials is known in the area around the Gulf of Suez. Here the best locations might deliver almost three times the amount of electricity compared to the calculations based on the ECMWF data. This will be shown in the following slides. The very conservative ECMWF data therefore also lead to very conservative scenarios. This has to be consider while evaluating the results of the scenarios. They therefore tend to be something like a worst case estimation. The real conditions will be better and therefore the electricity might be provided significantly cheaper. |

|
If we compare the Wind Resource Map of Morocco with the map derived from the ECMWF data we can see that latter shows quite satisfying analogy in some regions with less complicated and mountainous structures of the landscape. For example the conditions at the southern west coast show a relatively high degree of similarity. But extreme underestimations of the wind energy potentials can be seen at sites along the south eastern side of the Atlas Mountains. Here the best locations might deliver up to 3500 FLH and therefore many times the amount derived from the low resolution ECMWF data. |
|
If we compare the Wind Atlas for Egypt with the map derived from the ECMWF data we can see that latter shows quite satisfying analogy in regions with less complicated and mountainous structures of the landscape – even if the structures depicted in the Atlas show more details. Therefore the conditions are quite well represented in the areas to the west of the mountains along the Red Sea. But extreme underestimations of the wind energy potentials can be seen in the area around the Gulf of Suez. Here the best locations might deliver almost three times the amount of electricity compared to the calculations based on the ECMWF data.
Other preliminary studies of wind conditions point to significant underestimations of the real wind conditions in large parts of the Sahara if the site conditions are derived from the low resolution wind data of the ECMWF. This would mean that there are many other sites within the Sahara which might be characterised by very favourable wind conditions forming a highly interesting and huge potential for future electricity generation in many different countries. This may provide the possibility of diversification of the origin of electricity of a future international electricity supply and furthermore may give the chance to benefit from the export of wind energy to many North African countries. |
|
According to calculations of the Risø at the best locations at the Gulf of Suez the average annual wind speed might be higher than 11 m/s.
The blue circle shows an area where wind energy already is used. |
|
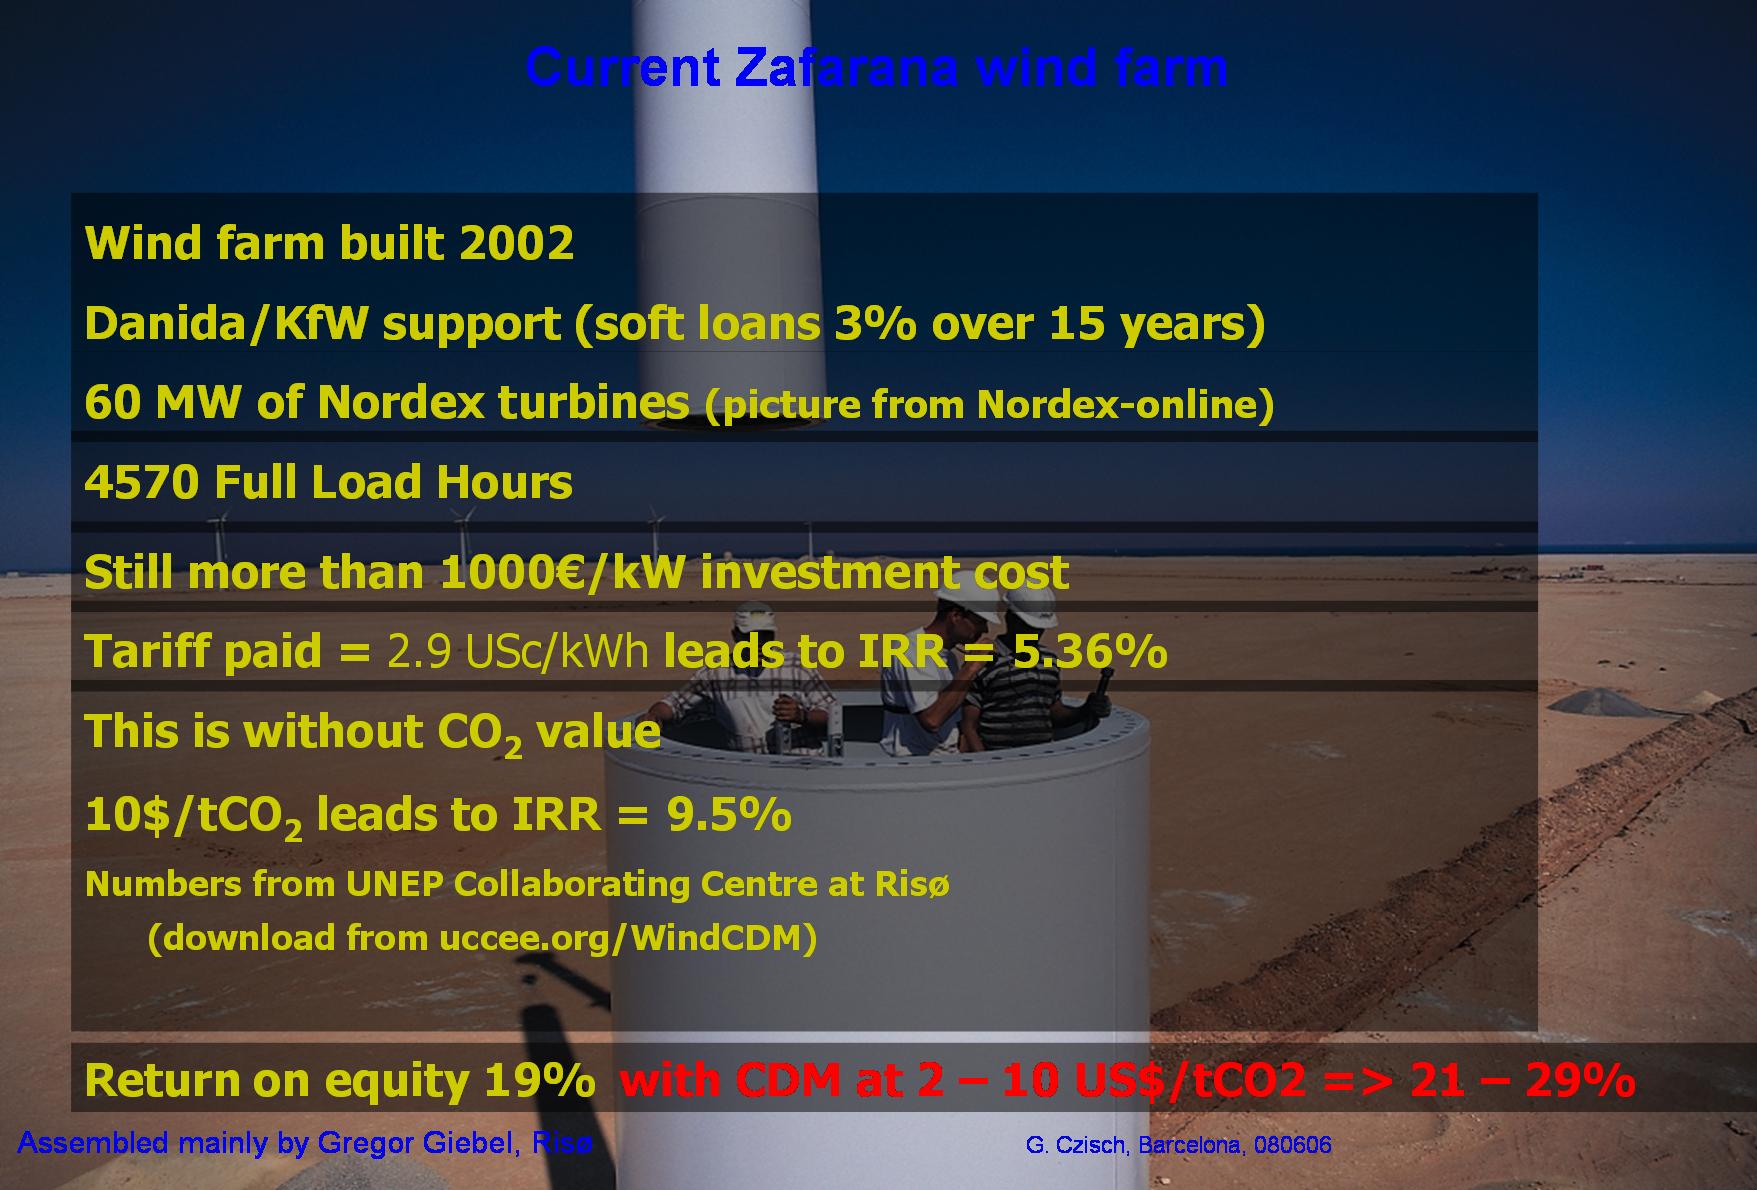
In this area since 2002 there is a wind park installed which produces electricity at more than 4500 full load hours (FLh = VLh) annually.
It provides the investor a return on equity of 19% at a feed in tariff of 2.9 USct/kWh. |
|
It is worth to consider the possibilities of designing the financing of renewable electricity production.
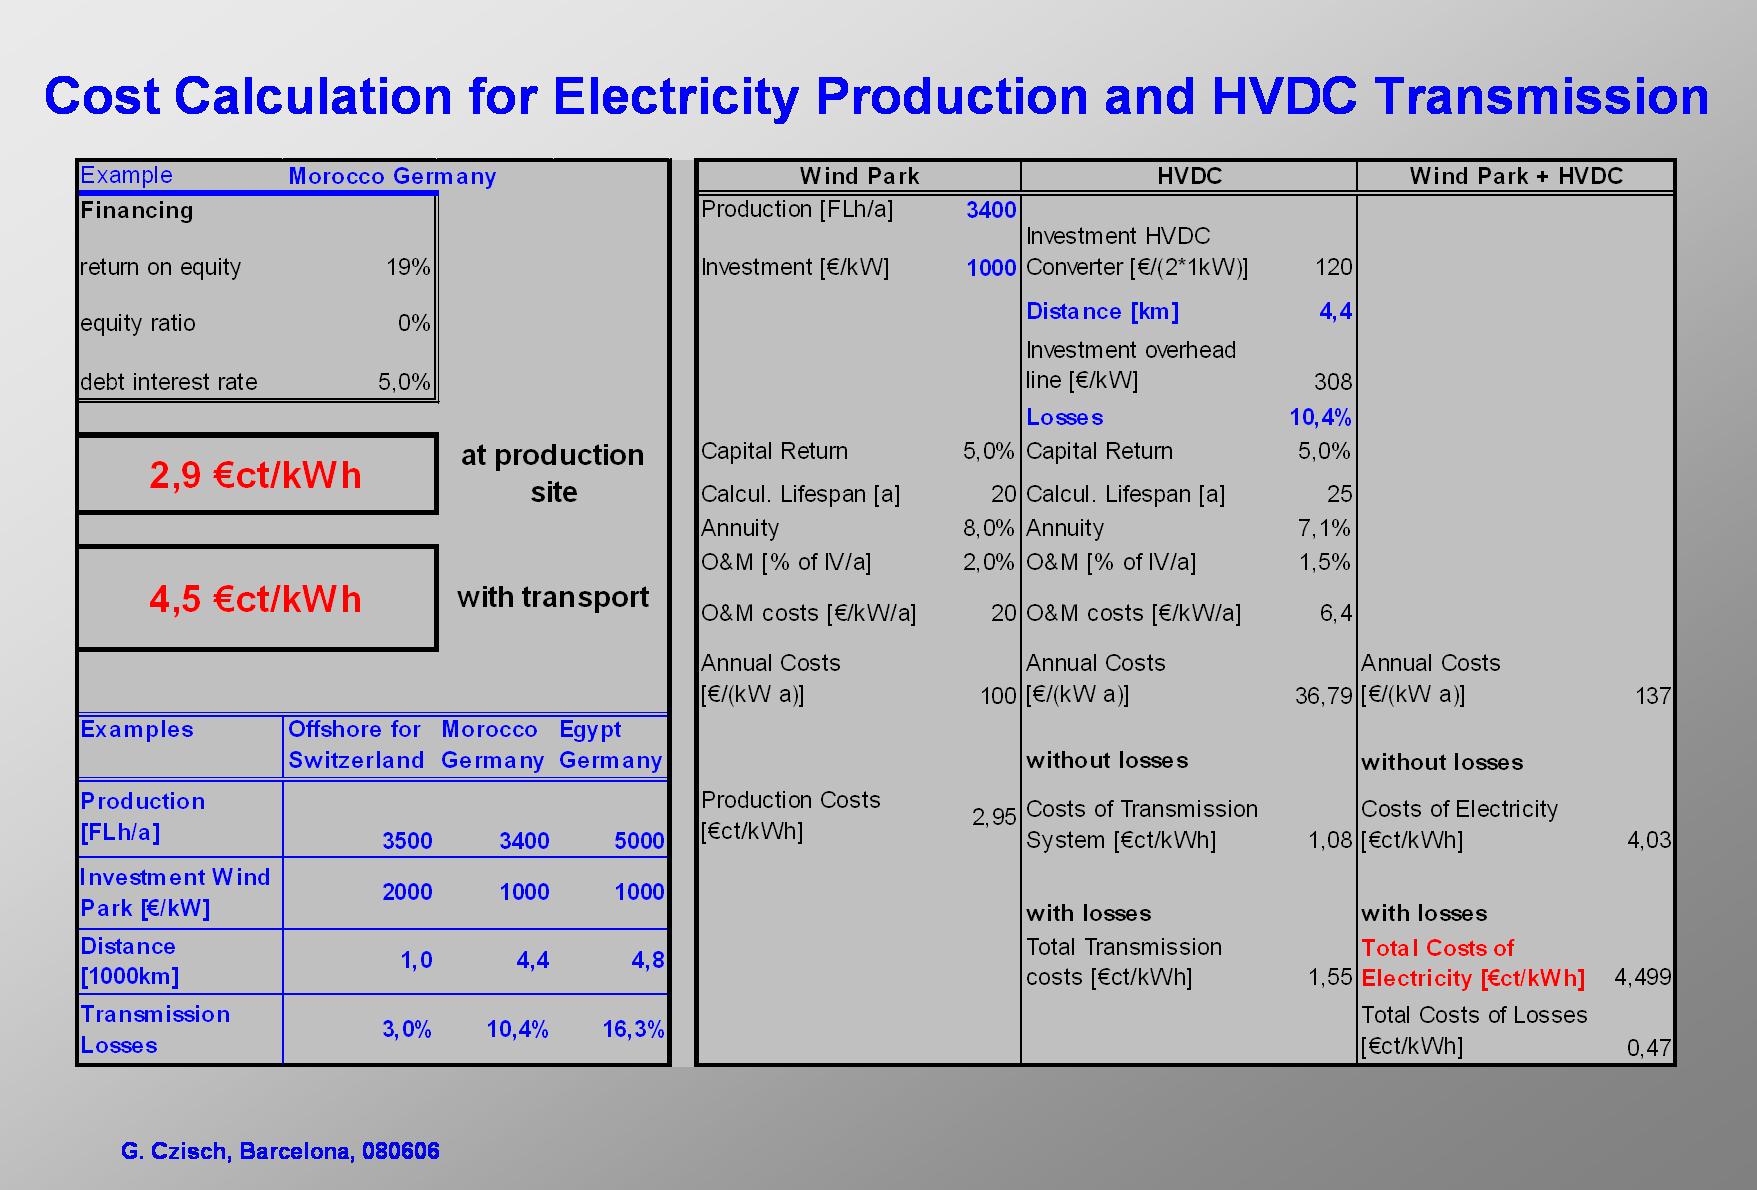
Since the biggest part of the costs of renewable electricity production very often is directly coupled with the investment the design of the financing has a very high influence on the resulting cost of electricity. I would like to highlight this influence by calculating some examples with this EXCEL sheet. I would like to start with an example where wind energy is used to produce electricity in Morocco and the costs of electricity are calculated at the site of production in Morocco as well as after transmission over a HVDC line to Germany – for different financing approaches. According to the low resolution data of the ECMWF it is conservative to calculate with an average production of 3400 FLH at the coast of Southern Morocco. The potential production of electricity at sites of this quality is very huge many better sites are available. For the costs of electricity the height of capital returns on the entire capital is crucial. It is highly influenced by the relation between debt and equity capital. One extreme would be that the entire capital is equity capital of an investor who claims for high returns on investment. Then the highest costs must be expected. If under these conditions for example the expected return on equity is 20% annually – a value which is quite common in the energy industry – the costs of electricity at the production site is 6.6 €ct/kWh. After transmitting the electricity to Germany the costs would be 10.4 €ct/kWh. An other extreme would be if the investment was financed from taxes and only the payback of the investment was requested over the live time of the wind turbines. Now the costs of electricity at the production site are 2.1 €ct/kWh. This is less then a third of the costs calculated for the previous example. After transmitting the electricity to Germany the costs would be 3.1 €ct/kWh. The cost relation between the high and the low extreme now is a factor of 3.4. All values in between these two extremes can be reached e.g. engaging – soft – loans with different interest rates and different equity shares. If for example a soft loan is available at a interest rate of 2.5% (Soft loans with comparable interest rates are quite common. For example in Germany such soft loans are given as part of energy saving programs.) and a equity share of only 10% of the total investment would be realised - at a return on equity of 20% - the costs of electricity at the production site would be 2.8 €ct/kWh. This is only about one third more than the cost of electricity calculated for the cheapest example. After transmitting the electricity to Germany the costs would be 4.3 €ct/kWh. The cost relation between this example and the low cost extreme now is a factor of 1.5. On the other hand the costs are only roughly 43% of the costs derived for the high cost extreme. This means that it should be a political aim to finance the electricity production from renewable energies by appropriate soft loans. This would lead to socially favourable electricity costs. Here, for example, the World Bank or state owned development banks as well as private financial institutions are called to care for adequate financial instruments. According to the Wind Resource Map of Morocco there are other good wind sites further north where also 3400 FLH could be expected. The transmission distance to Germany now would be about 1000 km shorter. But the cost difference in the case of the example with soft loans would be relatively small. The cost of electricity in Germany would be 4 €ct/kWh. So the electricity would only be 7% cheaper and the absolute difference would only be 0.3 €ct/kWh. One can state that the design of the financing is much more important than minor changes in the total investment and therefore e.g. in the prices of wind turbines. |
|
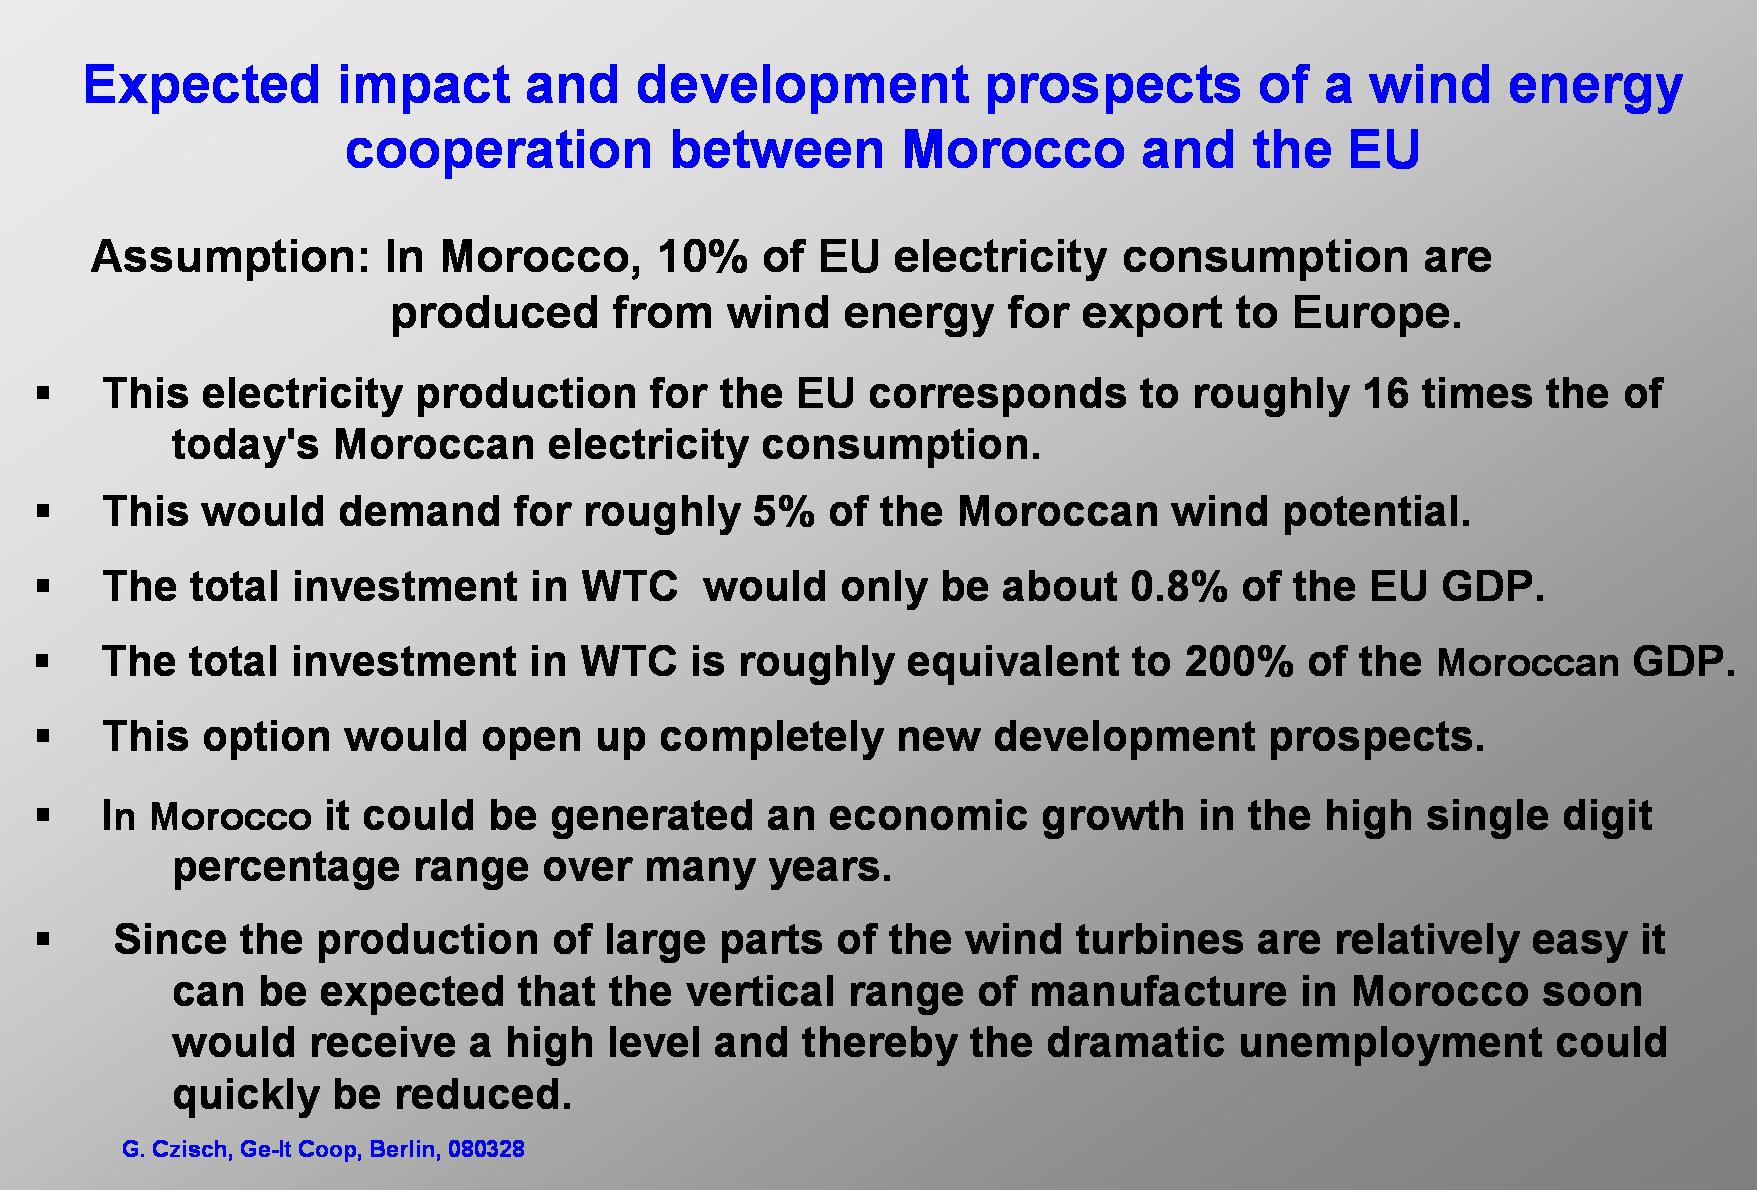
At this point of my talk I want to switch the point of view to an other aspect of the Extra-European option for an energy supply with wind power. I roughly want to sketch the idea to combine CO2 reduction and Development cooperation. Therefore I will compare two potential partners within a new electricity system and look at the economic impact of an international cooperation in the field of renewable energies. |
|
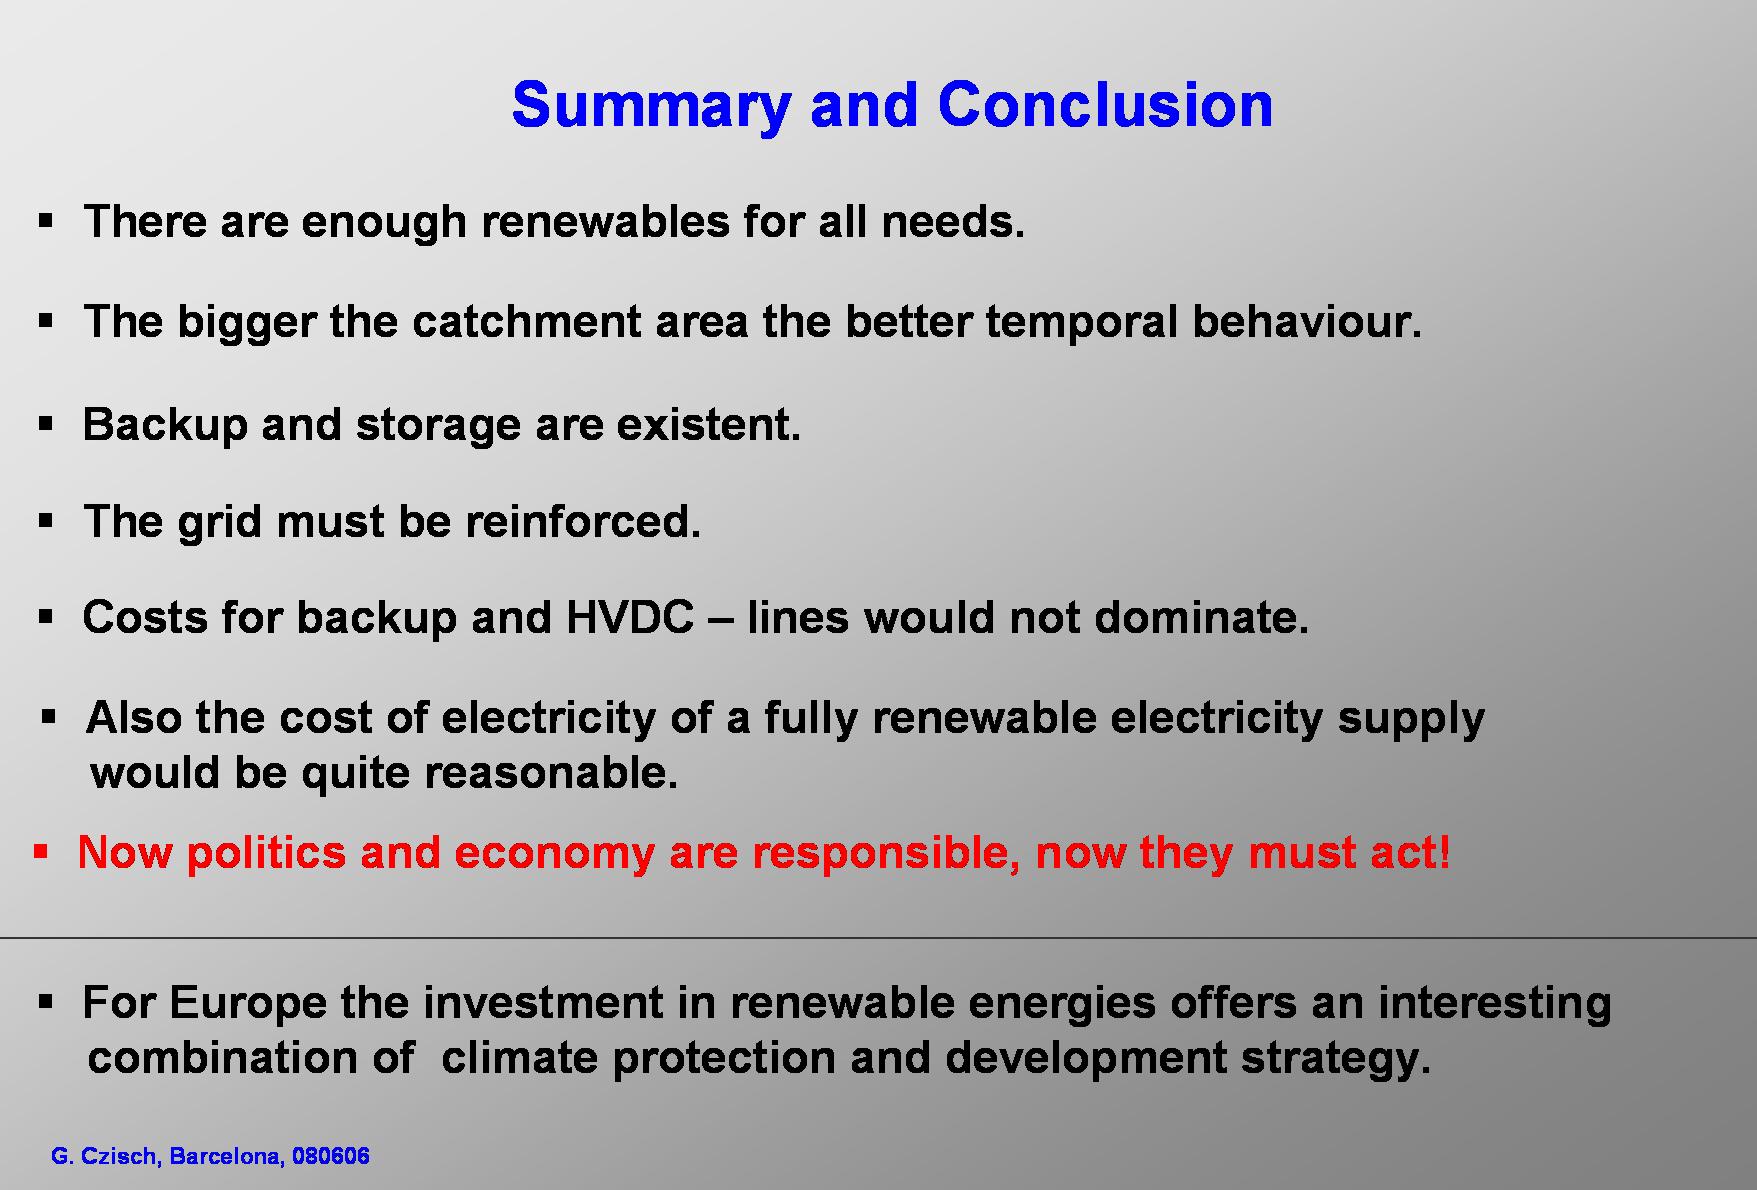
It is high time to act!
There is no technical or economic problem which must prevent us from changing our electricity supply to one that is based 100% on renewable energies! |

|
I also want to discuss the idea of an international instrument to boost the world wide use of wind energy (or other renewable energies) and simultaneously provide a new kind of development cooperation. It is the idea of an international feed in law. As an example I would like to discuss this idea on an Moroccan example while the question of costs and potential volume of renewable electricity feed in are discussed on the slide. ... |

|
Thank you for your attention. |
