Lecture Magdeburg 2001 - Overview: Unterschied zwischen den Versionen
Aus Transnational-Renewables
| Zeile 23: | Zeile 23: | ||
|- | |- | ||
|[[Datei:VM2001_slide4.jpg|200px|verweis=Lecture Magdeburg 2001 - Slide 4]] | |[[Datei:VM2001_slide4.jpg|200px|verweis=Lecture Magdeburg 2001 - Slide 4]] | ||
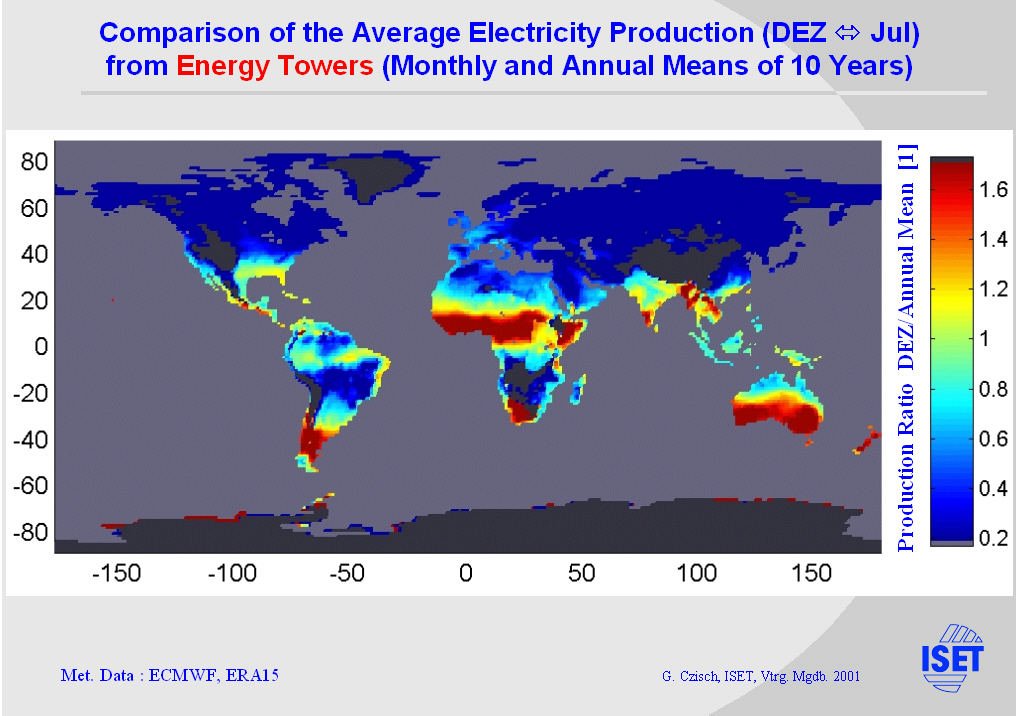
| − | | | + | |The seasonal variation of power production from PV panels is significantly lower at lower latitudes. On this slide you can see for example the ratio between the average electricity production in December and July. In the southern Sahara we find that the production only changes very slightly over the months while in Europe the winter production is only a small fraction of the summer production. |
|- | |- | ||
|[[Datei:VM2001_slide5.jpg|200px|verweis=Lecture Magdeburg 2001 - Slide 5]] | |[[Datei:VM2001_slide5.jpg|200px|verweis=Lecture Magdeburg 2001 - Slide 5]] | ||
| − | | | + | |Here the European conditions are shown. The seasonal variation of power production from PV panels for example in Northern Germany as well as in Northern Poland in December reaches only 10 % of the production in July. In Southern Europe the seasonal fluctuations are significantly lower. |
|- | |- | ||
|[[Datei:VM2001_slide6.jpg|200px|verweis=Lecture Magdeburg 2001 - Slide 6]] | |[[Datei:VM2001_slide6.jpg|200px|verweis=Lecture Magdeburg 2001 - Slide 6]] | ||
| − | | | + | |The monthly variation of PV power production can be studied in more detail comparing the different graphs on this slide. They show monthly averages for selected regions contrasted with the electricity consumption of the member states of the EU. |
| + | In this example only the production of Mauritania and Senegal in the Southern Sahara show a monthly variation similar to the mentioned electricity consumption. Within all the other regions the behaviour more or less shows an anticyclical pattern compared to the demand. | ||
|- | |- | ||
|[[Datei:VM2001_slide7.jpg|200px|verweis=Lecture Magdeburg 2001 - Slide 7]] | |[[Datei:VM2001_slide7.jpg|200px|verweis=Lecture Magdeburg 2001 - Slide 7]] | ||
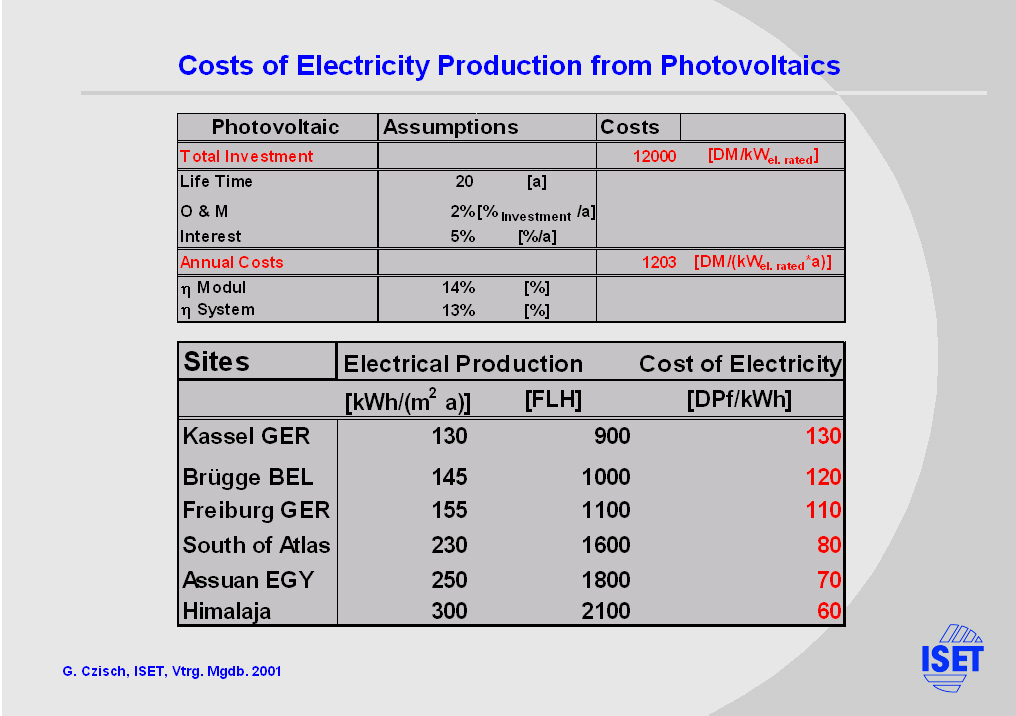
| − | | | + | |With the underlying economic assumptions shown in the upper table the costs of PV electricity production at some selected sites are calculated and the results are listed in the lower table. |
| + | The costs of PV electricity production are relatively high, so that at the today's investment it seems to be an option for rural areas with high potential and without grid connection where it competes with other sometimes even more expensive techniques. | ||
|- | |- | ||
|[[Datei:VM2001_slide8.jpg|200px|verweis=Lecture Magdeburg 2001 - Slide 8]] | |[[Datei:VM2001_slide8.jpg|200px|verweis=Lecture Magdeburg 2001 - Slide 8]] | ||
| − | | | + | |Here you see a view of a solar thermal power plant which leads us to the potentials of this kind of electricity production. The direct solar radiation is concentrated in parabolic troughs to heat up a fluid that is used to power a conventional thermal power plant. Dependent on the design of the power plant the heat is used with an efficiency between approx. 32 and 38 % to produce electricity. |
| − | |||
|- | |- | ||
|[[Datei:VM2001_slide9.jpg|200px|verweis=Lecture Magdeburg 2001 - Slide 9]] | |[[Datei:VM2001_slide9.jpg|200px|verweis=Lecture Magdeburg 2001 - Slide 9]] | ||
| − | | | + | |Here the potential heat production of the solar field of a SEGS power plant is shown. Very good conditions are found in the Sahara where the potential electricity production is more than 500 times the electricity consumption of the EU member states. |
|- | |- | ||
|[[Datei:VM2001_slide10.jpg|200px|verweis=Lecture Magdeburg 2001 - Slide 10]] | |[[Datei:VM2001_slide10.jpg|200px|verweis=Lecture Magdeburg 2001 - Slide 10]] | ||
| − | | | + | |The seasonal variation of power production from SEGS power plants is significantly lower at lower latitudes. |
| + | On this slide you can see for example the ratio between the average electricity production in December and July. As it is the case for the PV electricity production, in the southern Sahara we find that the production only changes slightly over the months while the variations increase considerably going to higher longitudes. | ||
|- | |- | ||
|[[Datei:VM2001_slide11.jpg|200px|verweis=Lecture Magdeburg 2001 - Slide 11]] | |[[Datei:VM2001_slide11.jpg|200px|verweis=Lecture Magdeburg 2001 - Slide 11]] | ||
| − | | | + | |The monthly variation of power production from SEGS power plants can be studied in more detail comparing the different graphs on this slide. They show monthly averages for selected regions contrasted with the electricity consumption of the member states of the EU. |
|- | |- | ||
|[[Datei:VM2001_slide12.jpg|200px|verweis=Lecture Magdeburg 2001 - Slide 12]] | |[[Datei:VM2001_slide12.jpg|200px|verweis=Lecture Magdeburg 2001 - Slide 12]] | ||
Version vom 10. Juli 2010, 11:59 Uhr
Global Renewable Energy Potential
- Approaches to its Use -
held in Magdeburg, Germany on September 2001


