Lecture Barcelona 2008 - Slide 21
Aus Transnational-Renewables
| Lecture Magdeburg [2001,en], Vortrag Lübeck [2006,de], Lecture Barcelona [2008,en], Vortrag EWEA 2000 [2000,en] |
| Vorstellung regenerativer Energien: Biomasse, Windenergie, Fallwindkraftwerke, Geothermie, Wasserkraft, Solarenergie |
| Overview | 
|
Now we look at the results of some other scenarios.
Inhaltsverzeichnis
Scenario with Transport Restrictions
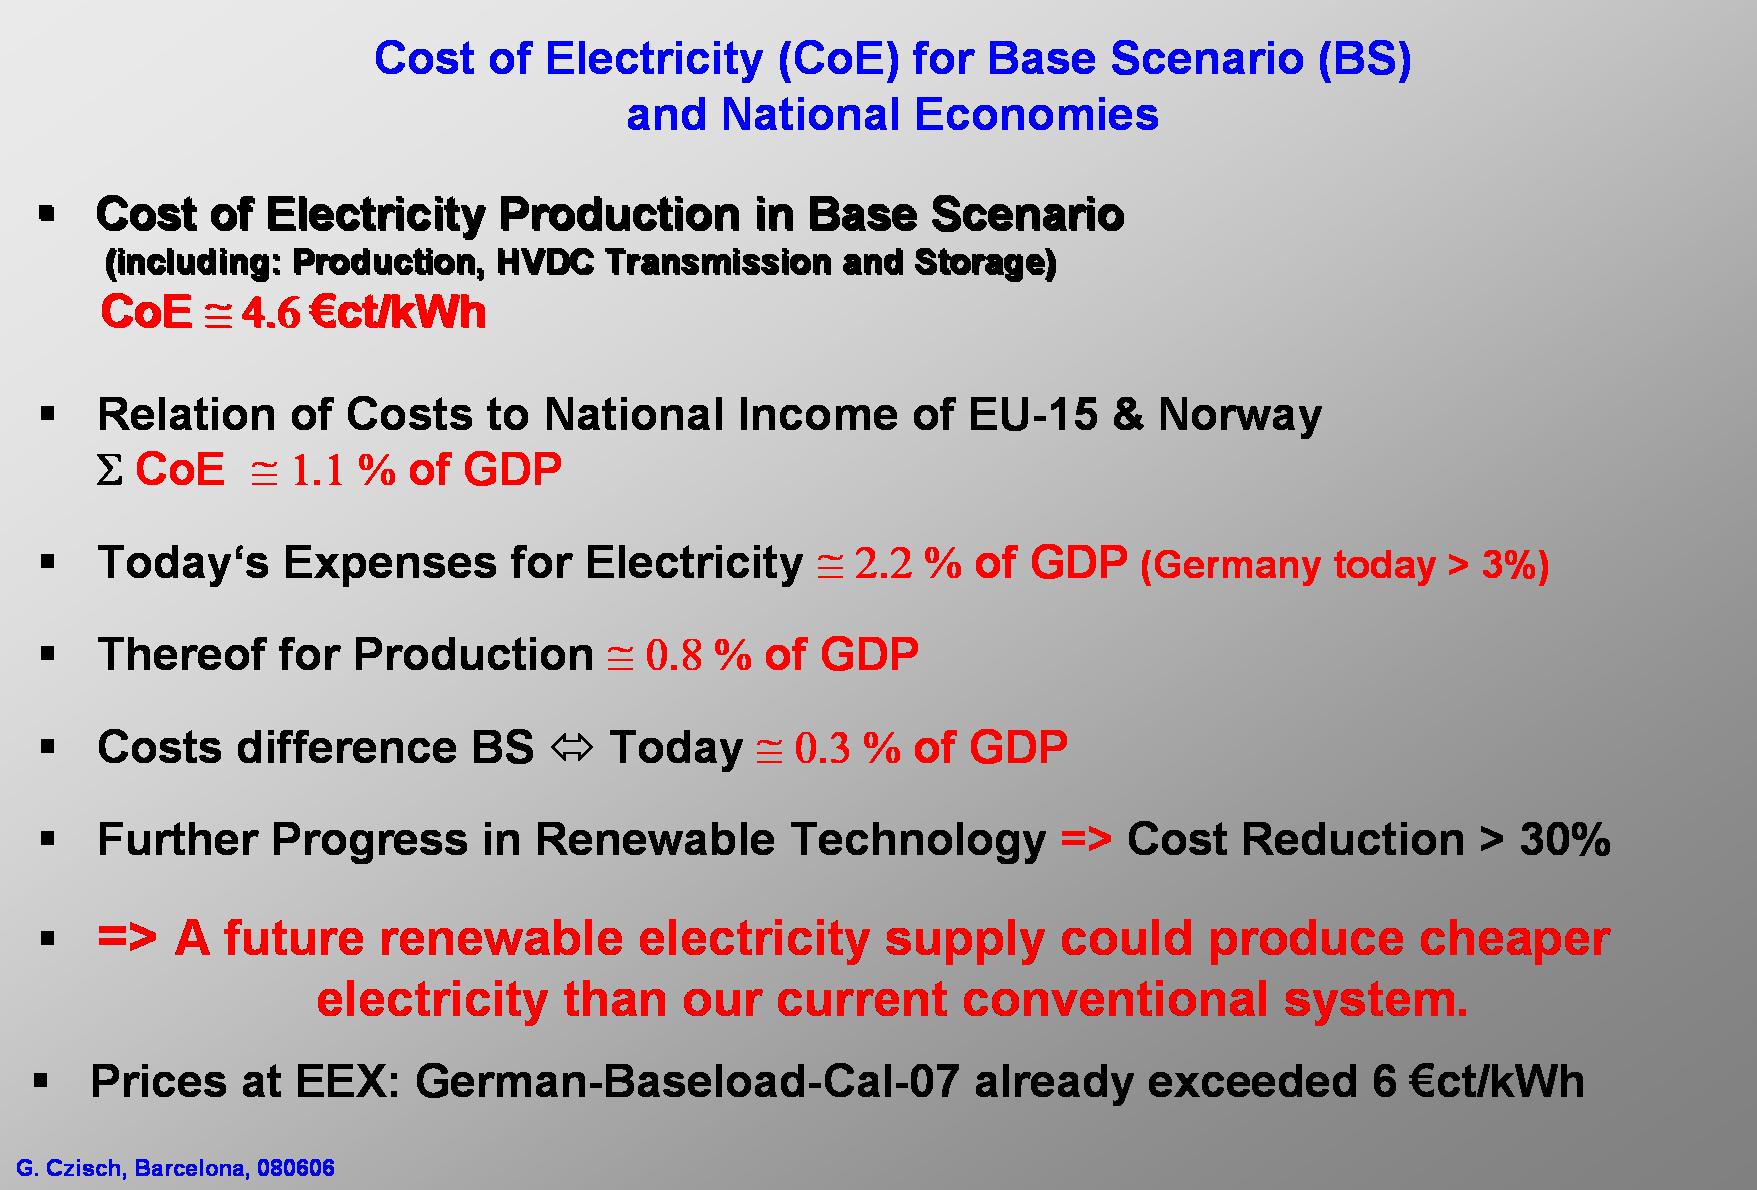
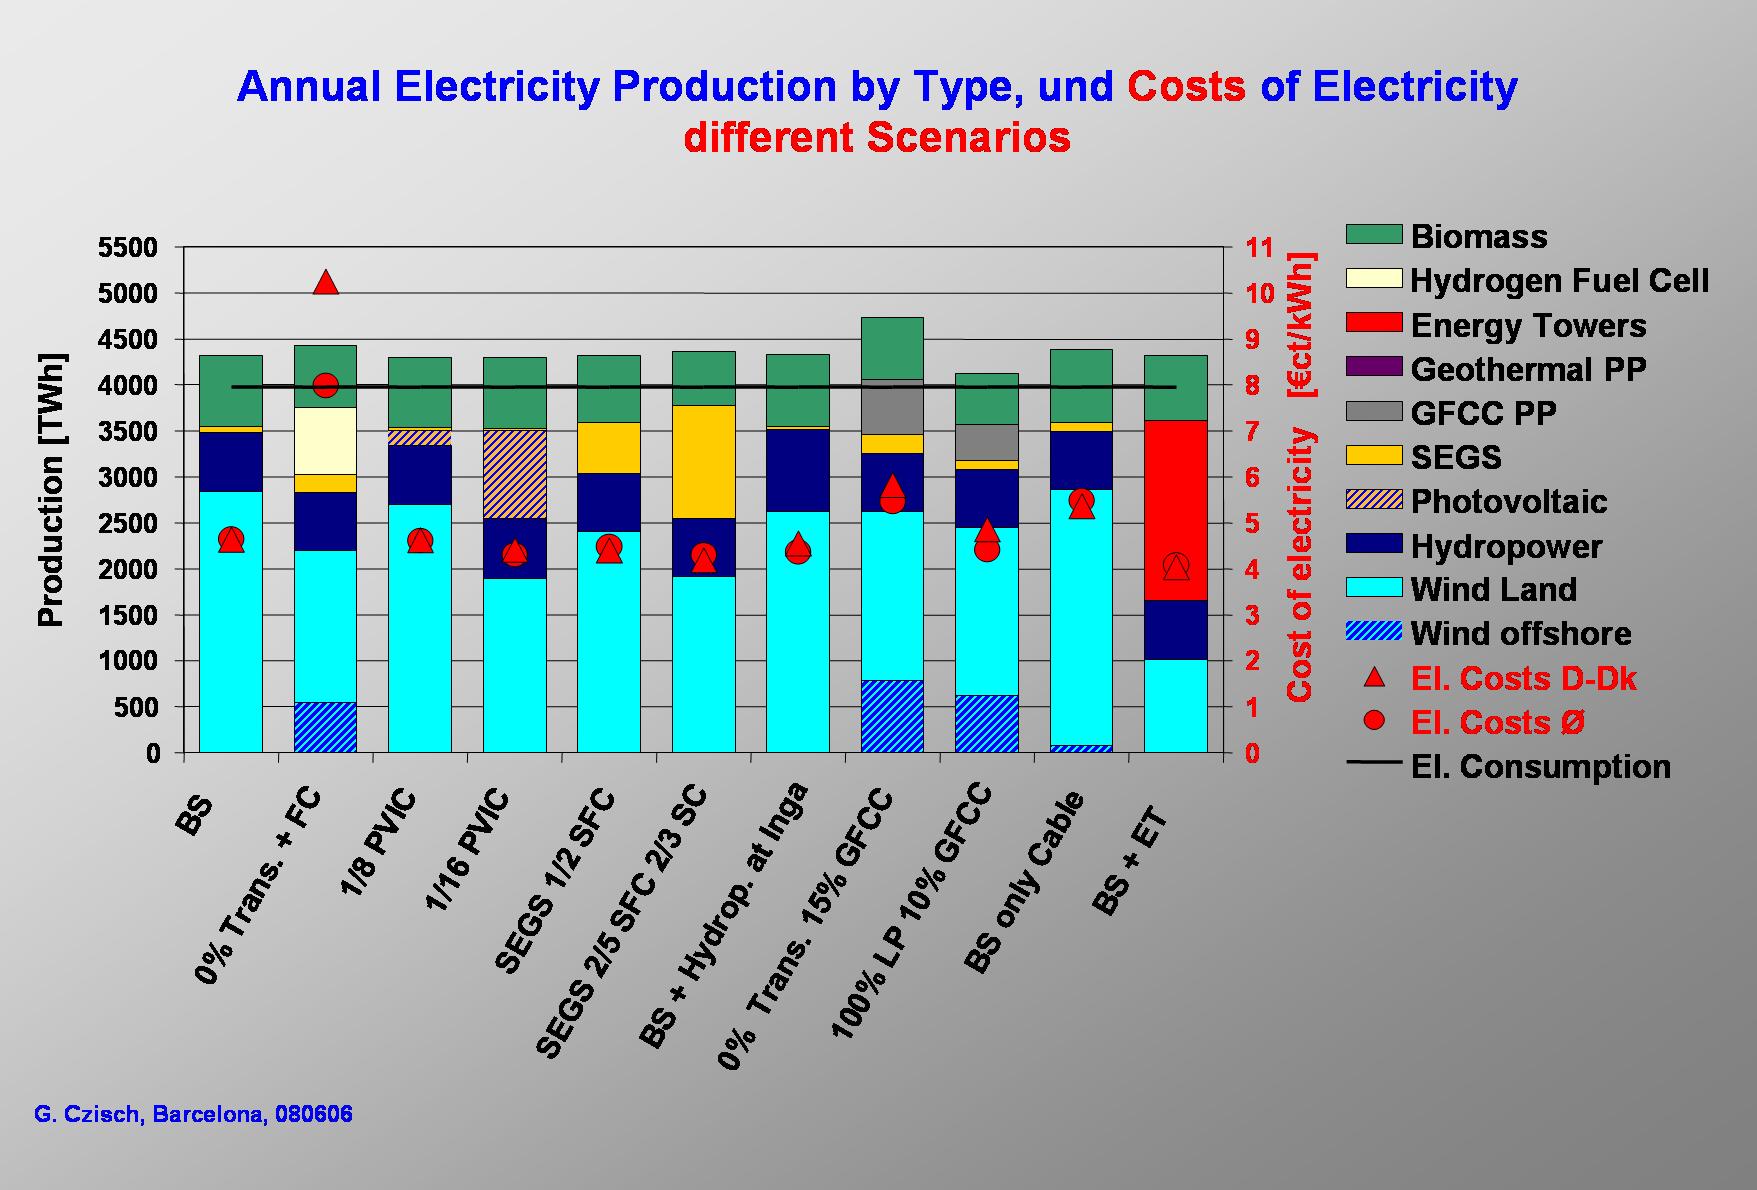
In contrast to the base case scenario, if interregional transmission is not allowed in a restrictive decentralised scenario, excess production increases significantly to 10% of the production, and additional backup power as well as backup energy employing other resources become necessary within individual isolated regions to meet the demand, leading to great additional expenses. In one scenario (0% Trans + FC), fuel cells powered with renewable hydrogen produce electricity at about 20 €ct/kWhel (which is already quite optimistic if the hydrogen is produced from renewable energies), raising the net electricity costs to over 8 €ct/kWhel on the average. For Region 6 (Germany and Denmark), this restrictive „decentralized” (insular) strategy would lead to costs of electricity greater than 10 €ct/kWh.
Scenarios with Reduced Costs for Individual Components
The effect of cost changes for individual technologies and components was also investigated in particular scenarios. One aim was to find the costs at which PV could cost-effectively contribute to the supply. Therefore a series of scenarios has been calculated where the PV costs successively have been divided by two. As a result PV has not been chosen by the optimisation until costs have been halved three times to one eighth of the current costs (scenario 1/8 PVIC). This major cost reduction for PV would enable this technology to provide a significant contribution to the electricity supply. If all other costs remained the same, a reduction to one-eighth of current PV costs would enable an economically viable 4% contribution to overall electricity generation to be provided by PV. The generation would nevertheless be limited to the southernmost regions – particularly to regions 12,16, 17, and 18. If the cost were only one-sixteenth of present levels (scenario 1/16 PVIC), PV technologies could account for about 22% of all electricity generation, reducing generation costs compared with the base case scenario by about 10% to 4.3€ct/kWh. Even in this case, however, photovoltaic technologies would not be used in the northern regions 1, 2, 3, 6, 9, and 19, because they could not contribute to overall cost reductions.
If the costs of the mirror fields of solar thermal power plants were reduced by half (scenario SEGS ½ SFC) – as is anticipated in the near future – solar thermal power plants would already constitute about 13% of all electricity generation. In this case, the overall electricity costs lie at 4% below those of the base case scenario. Reducing the costs of the collector array to 40% and simultaneously lowering storage costs to two-thirds (scenario SEGS 2/5 SFC 2/3 SC) of current levels (still clearly above achievable storage costs according to the recent research mentioned above) would increase their contribution to 28% of the electricity produced, while the electricity generation costs would – compared to the base case scenario - fall by about 10% to 4.3 €ct/kWh. These examples illustrate that solar thermal generation presents an economically attractive perspective for the future that can be realized fairly easily in view of minimal cost regression factors.
Scenario with Hydropower at Inga in the Democratic Republic of Congo (BC + Hydrop. At Inga) The construction of a large hydroelectric power plant at an extremely favourable location in the Democratic Republic of Congo near Inga was also investigated for one proposed scenario (s. also [Kan 99]) The construction of a hydropower plant with a capacity of 38 GW was the decision resulting from computational optimisation. This would lower the costs of electricity by 5.3% compared to the base-case scenario due to more economic generation and incidental system benefits. A primary reason for the low costs of the electricity produced at Inga is the high average load of the hydropower plant of about 6900 FLH and the relatively low anticipated investment costs at this very advantageous site. Two-thirds of the electricity produced at Inga is transmitted over a HVDC system with 26GW capacity, connecting the generating station with Region 17, with the remainder conducted in equal amounts over two HVDC systems with a combined capacity of 12 GW, joining Inga with Regions 16 and 18.
Electricity Transmission within the Scenarios
In all scenarios – with the exception of restrictive and expensive insular configurations – electricity transmission is of significant importance. The necessary converter capacity (AC DC) for the HVDC grid exceeds values of 750 GW in some cases. (This level corresponds to about one-half of the installed generation capacity of all production facilities in the scenario regions.) The grid is used to achieve smoothing effects among different resource-dependent generation capacities using renewable energies, and to provide access to hydroelectric plants and to distributed biomass power plants both with associated storage capacity for wide-area backup applications. In the base case scenario, for instance, about 42% of the electricity generated is transmitted over the HVDC system between the regions within the supply area. Measured against the total electricity costs the cost of the transmission system amounts to 7% of which the main part of 5% is contributed by the transmission lines and cables. HVDC transmission has a higher intrinsic system stability than AC lines. Furthermore the transmission system of the base case scenario is highly redundant due to the fact that the thermal limit of the transmission lines is about twice the rated power and due to the fact that between almost all regions two or more systems are designed to be built parallel. But nevertheless if further redundancy was seen as desirable this could be relatively inexpensively achieved. A somewhat extreme idea would be to erect two whole systems of transmission lines in parallel. This would mean that the costs of transmission lines and cables would double but at the same time the losses would decrease because of the doubled cross-section and thus the overall cost increase would only be about 3% ensuring a degree of immunity against faults, which is by far higher than stipulated for today’s systems.
Scenarios with Technologies Under Development
Since the implementation of the base case and similar scenarios will take many years, an attempt has been made to include some promising power generation technologies already on the horizon. A somewhat speculative scenario includes the use of energy towers (scenario BC + ET) . Should the assumptions used for energy towers hold true, especially the economic ones, then – according to the optimisation - those power plants would dominate with a generation equivalent to 49% of the total annual electricity consumption in the scenario area. The overall generation cost is with just below 4.1 €ct/kWh about 12% less than in the base case scenario. Solar thermal generation is completely replaced by the optimisation comparet with the base case scenario, but also large shares of wind power as well as a minor shares of biomass use. This scenario shows that further development of this technology might be worth while. Therefore research into the technology is needed, aiming to reduce the financial risk involved with building such a type of power plant and focussing on everything necessary to build a prototype of this kind of power plant which has not yet been tested. Generally, one can derive from that result that there should be more research grants and more venture capital devoted even to speculative ideas, which might have the potential to deliver energy at low prices and from different renewable sources.
The principle of the energy tower. Hot air streams from above into a large tube, water is injected to cool the air, which therefore is heavier than the surrounding air and falls down. At the bottom of the shaft it drives some turbines which produce electricity. For more details about Energy Towers see:
Realisable Scenarios for a Future Electricity Supply based 100% on Renewable Energies http://www.risoe.dk/rispubl/reports/ris-r-1608_186-195.pdf
Energy Towers for Producing Electricity and Desalinated Water without a Solar Collector http://www.iset.uni-kassel.de/abt/w3-w/projekte/ET-Brochure_Zaslavsky++_2006.pdf
Evaluation of the potential of electricity by using technology of "Energy Towers" for the Middle East and India-Pakistan http://www.iset.uni-kassel.de/abt/w3-w/projekte/ECMWF-IR-SPDEGPET200705.pdf
Evaluation of the potential of electricity and desalinated water supply by using technology of "Energy Towers" for Australia, America and Africa http://www.iset.uni-kassel.de/abt/w3-w/projekte/ECMWF-IR-SPDEGPET200605.pdf
ENERGY TOWER CONCEPT FROM ISRAEL Generating Large Scale Renewable Electric Power Without Fuel SUMMARY OF PRESENTATIONS & REVIEWS IN INDIA http://www.iset.uni-kassel.de/abt/w3-w/projekte/ET-Brochure-India-200005.pdf


